EddieCH
Member
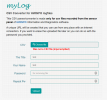
Upload csv files generated with the HWiNFO Sensor Panel
This is the direct Upload Link
I made myLog as a mate for the Online Report Converter/Viewer myRig.
Remarks:
- Up to 4 charts displayed. Temperature, RPM, MB, Percentage
- Show/Hide Parameters. Hover charts to show each timestamps values
- Change height and/or blow up charts to full width with horizontal scroll
- Draggable popup tables that display low/hig values and there first occurence in the timeline
This is the direct Upload Link
I made myLog as a mate for the Online Report Converter/Viewer myRig.
Remarks:
- For long recordings I'd choose higher intervals. The Demo - for example - is a 1 hour recording with an interval of 5 secs.
- At the moment a max. of the first 1200 steps will be displayed. File itself will be kept intact, so it will still work when steps are scaled up, too
- Compatibility: All current browswers, iOS Safari and Android 3+. IE 6/7/8 not supported (no SVG)
- Tested with HWiNFO 4.48-2350 - 4.51-2410(beta)
- If recording Fahrenheit the correct values are displayed, but units will still have 'C' in them because header top/bottom rows in csv do not change to 'F'. Even so... who the heck is using Fahrenheit?

