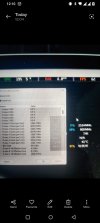
I'm assuming for CPU utilisation on the Rog Ally is Core 0 Clock 0 (perf #7/) but that option is not showing in the hwinfo drop-down on my Ally. This user on Reddit has the option, please see screenshots
Please help.
Please help.
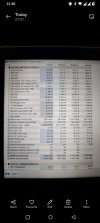
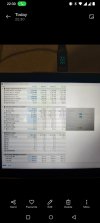
What's shown in the HWiNFO sensors window?
Look above, under the CPU sensor.
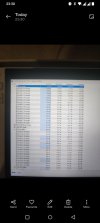
"Core Usage", "Core Utility" - Expand those nodes
Or "Total Core Usage", "Total Core Utility"
So HWiNFO reads and reports those. Issue is in RTSS which pulls them from HWiNFO.
Ok it seems to be one of the P-cores, because it was renamed I was confused. So which one do I select to match the built CPU clock overlay?What exactly? That one shows both Usage and Utility.
which core do I choose to match the ally's built in overlay?Sorry, I don't understand what the problem is and you don't understand what I'm trying to say.