AeroZ
Active Member
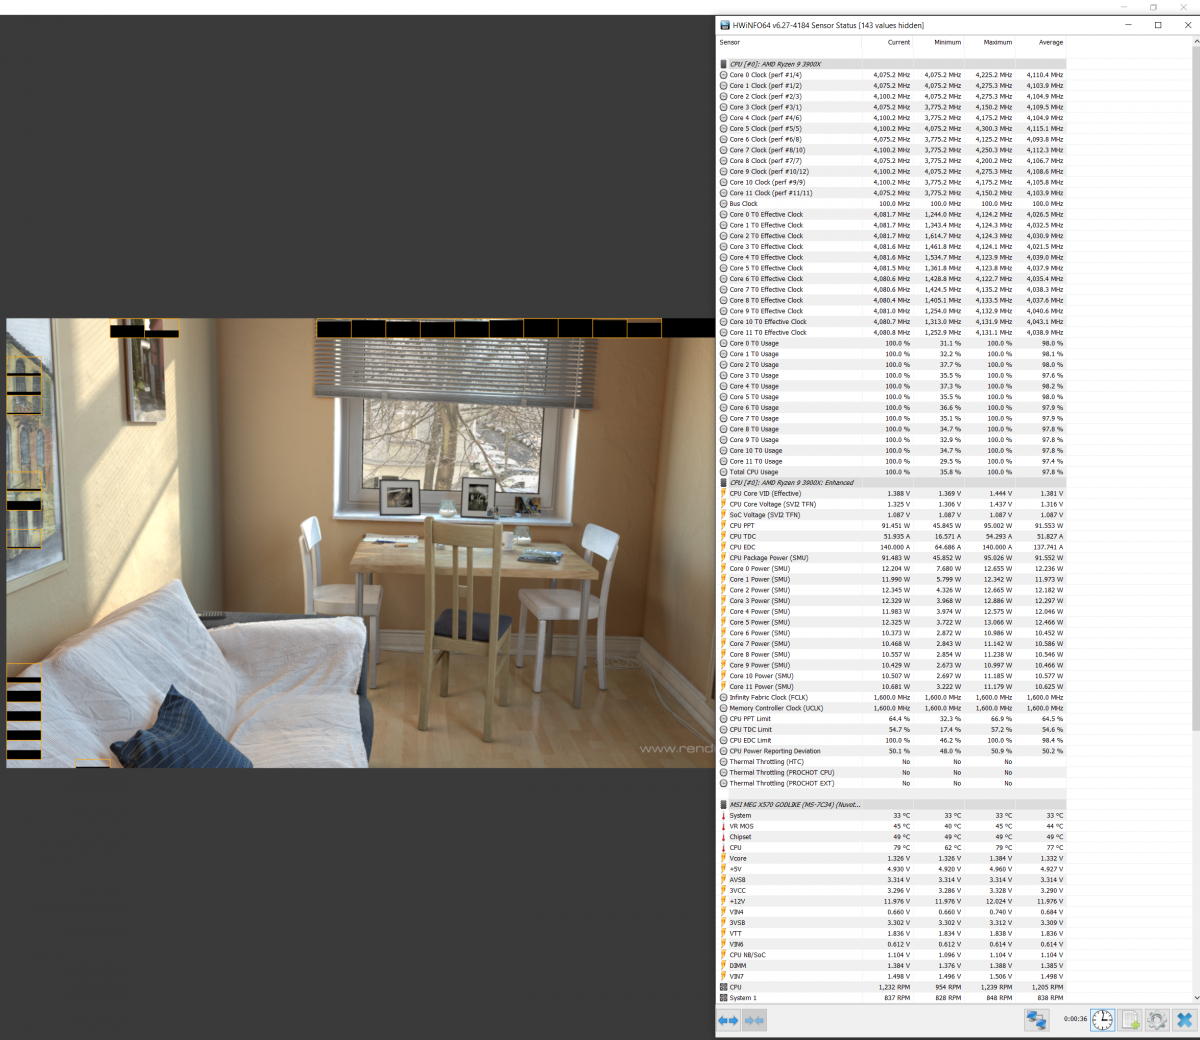
I opened a support case with Gigabyte regarding this. We’ll see what they say. I’m currently running F12 BIOS but F13 beta is already in testing. Maybe it’s just related to current BIOS/AGESA.In that case yes your board is very off in reporting Power. Even so, the CPU does not exceed its limits. Your CPU has 125W PPT limit, and on your screenshot we see a true power of just 100W (67 / 0.67 = 100)
Its not Gigabyte specific but maybe BIOS version specific. My X570 AorusPro has a 91~94% PRD.
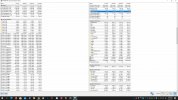
This is under R20
PPT reports 85W with 92% PRD (85 / 0.92 = 92W)
My 3600 has a 88W PPT limit but because of low temp the CPU allow itself to go a little over 88W.
View attachment 5942
I don’t like my 80C temps as well but I guess that’s the best a CoolerMaster 212 can do.