HWiNFO v6.40 released

Martin

HWiNFO Author
Staff member
HWiNFO v6.40 available.

Changes:
  • Enhanced sensor monitoring on ASUS H570, B560, H510 and Q570 series.
  • Added reporting of Precision Boost Clock Limit and Automatic OC Offset on AMD Vermeer.
  • Fixed monitoring of CPU power and HTC status on AMD Zen3.
  • Improved support of Intel Alder Lake and hybrid core architecture.
  • Improved SMART support of some SSD drives.
  • Improved CPU polling efficiency.
  • Added Snapshot Polling mode for AMD Zen-based CPUs.
  • Fixed and updated DDR5 support.
  • Revamped monitoring of AMD Vega and Navi GPUs, added new items (PPT, TDC, Thermal limits, FPS counter).
  • Clicking the clock bar window will toggle between active and effective clock display.
 
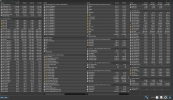
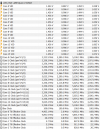
Hey man, i know this is not the place to talk about, and i'm sorry, but do u have any idea why HWINFO sensors are like this? 1607544198303.png
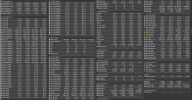
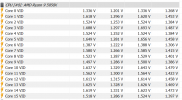
I know it seems normal but before i updated i didn't have those things1607544232514.png everything was normal and i didn't need scroll to see average and maximun values
 
Hey man, i know this is not the place to talk about, and i'm sorry, but do u have any idea why HWINFO sensors are like this? View attachment 5541
I know it seems normal but before i updated i didn't have those thingsView attachment 5542 everything was normal and i didn't need scroll to see average and maximun values

I don't know how that happened, but scroll to right and adjust the column width via the respective header.
 
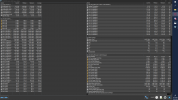
I've tried but i can't1607544774118.pngThis is how it was before, and if i try to just have 2 graphs i have this weird thing1607544803290.pngI've already tried to move the distance manually but it doesn't move at all
 
You need to adjust the width of columns via their headers - the | Sensor | Current | Minimum | ... etc. on top of the list.
 
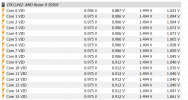
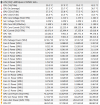
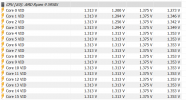
So have a strange issues with 5950x, using pbo and curve optimizer. Haven't tried with manual overclocking or stock setting yet. Seems the current voltage reading for cores other than core 0 are incorrect or being tied to each other. The resting state voltages for all cores but 0 are also much higher than they should be. These are much different that with the previous version I had installed (I believe 6.38). All cores excluding 0 and 6 should be at a state just slightly greater than 0.81v, with the two outliers near 0.87 and greater. This is because of undervolting taking place in pbo/curve optimizer. I am not sure what may be causing the issue. The issues seems to also persist when the cpu is at load, with cores being tied to each other even under single core loads such as cinebench r20 (second photo).

Here's an example of what I mean:
Screenshot 2020-12-10 194033.png
Screenshot 2020-12-10 194949.png

These results didnt seem to appear until I updated to the newest hwinfo, but its possible a recent windows update has done this as well.

Cheers!
 
So have a strange issues with 5950x, using pbo and curve optimizer. Haven't tried with manual overclocking or stock setting yet. Seems the current voltage reading for cores other than core 0 are incorrect or being tied to each other. The resting state voltages for all cores but 0 are also much higher than they should be. These are much different that with the previous version I had installed (I believe 6.38). All cores excluding 0 and 6 should be at a state just slightly greater than 0.81v, with the two outliers near 0.87 and greater. This is because of undervolting taking place in pbo/curve optimizer. I am not sure what may be causing the issue. The issues seems to also persist when the cpu is at load, with cores being tied to each other even under single core loads such as cinebench r20 (second photo).

Here's an example of what I mean:
View attachment 5555
View attachment 5556

These results didnt seem to appear until I updated to the newest hwinfo, but its possible a recent windows update has done this as well.

Cheers!

Try with the "Snapshot CPU Polling" option enabled. That should reflect the low power states much more accurate, especially the VIDs.
 
Try with the "Snapshot CPU Polling" option enabled. That should reflect the low power states much more accurate, especially the VIDs.
Thank you very much for this! Works great with PBO overclocking.

I do have another question though, branching off of this one. For per CCX overclocking now, using "Snapshot CPU Polling", I am getting very very high current voltage readings under load conditions. Without "Snapshot CPU Polling" used, I am getting what I would expect as the current voltages given the settings. Settings used: 1.375v override voltage, LLC 3 , per CCX OC.

Voltages (under load) and power for "Snapshop CPU polling":
Screenshot 2020-12-12 113843.png
Screenshot 2020-12-12 114041.png

Voltages (under load) and power w/o "Snapshot CPU Polling":
Screenshot 2020-12-12 114220.png

Screenshot 2020-12-12 114257.png

I am not sure if this behavior is to be expected but I wanted to bring it to your attention.

Cheers! and thanks agian!
 
All VID voltages are only the target (requested) values, you should not make any judgements based on that .
"CPU Core VID (Effective)" is the final VID requested (the value that "won" among all cores) and "CPU Core Voltage (SVI2 TFN)" is the voltage provided by VR to the CPU.
 
All VID voltages are only the target (requested) values, you should not make any judgements based on that .
"CPU Core VID (Effective)" is the final VID requested (the value that "won" among all cores) and "CPU Core Voltage (SVI2 TFN)" is the voltage provided by VR to the CPU.
Understood! Thank you very much! So really should only concern myself with "CPU Core Voltage (SVI2 TFN)" since it is the actual voltage fed to the cpu. I am assuming that the mobo is ignoring the requesting VID (CPU Core VID (Effective)) and just feeding what was set within the bios outside of any "AMD Overclocking" settings (since they are not used in this case).
 
hello,

did anythign change in the temperasture reading of Tdie for amd 3700x ? i mopnitor the Tdie value because it was the closest to the Amd ryzen one and doesnt jump like crazy like the Tdie/Tctl one...
however after the latest update they seem to jump a lot (doing peaks) just like tdie/tctl but a bit lower....
 
No change, Tdie (average) is still the same value.
I think he ment the “CCD (Tdie)”


hello,

did anythign change in the temperasture reading of Tdie for amd 3700x ? i mopnitor the Tdie value because it was the closest to the Amd ryzen one and doesnt jump like crazy like the Tdie/Tctl one...
however after the latest update they seem to jump a lot (doing peaks) just like tdie/tctl but a bit lower....
Tctl/Tdie is the one all over the place, because it’s not from 1 sensor, it’s switches to report always the highest one.
CCD(Tdie) is probably from 1 sensor on one side of CCD. In certain situations could be also up and down (but a little smoother) because the actual size of the CCD is rather small and the heat is such that affects the entire CCD surface.
The Die(average) as is says it’s the average of all sensors, so it’s the smoothest one.
 
Back
Top