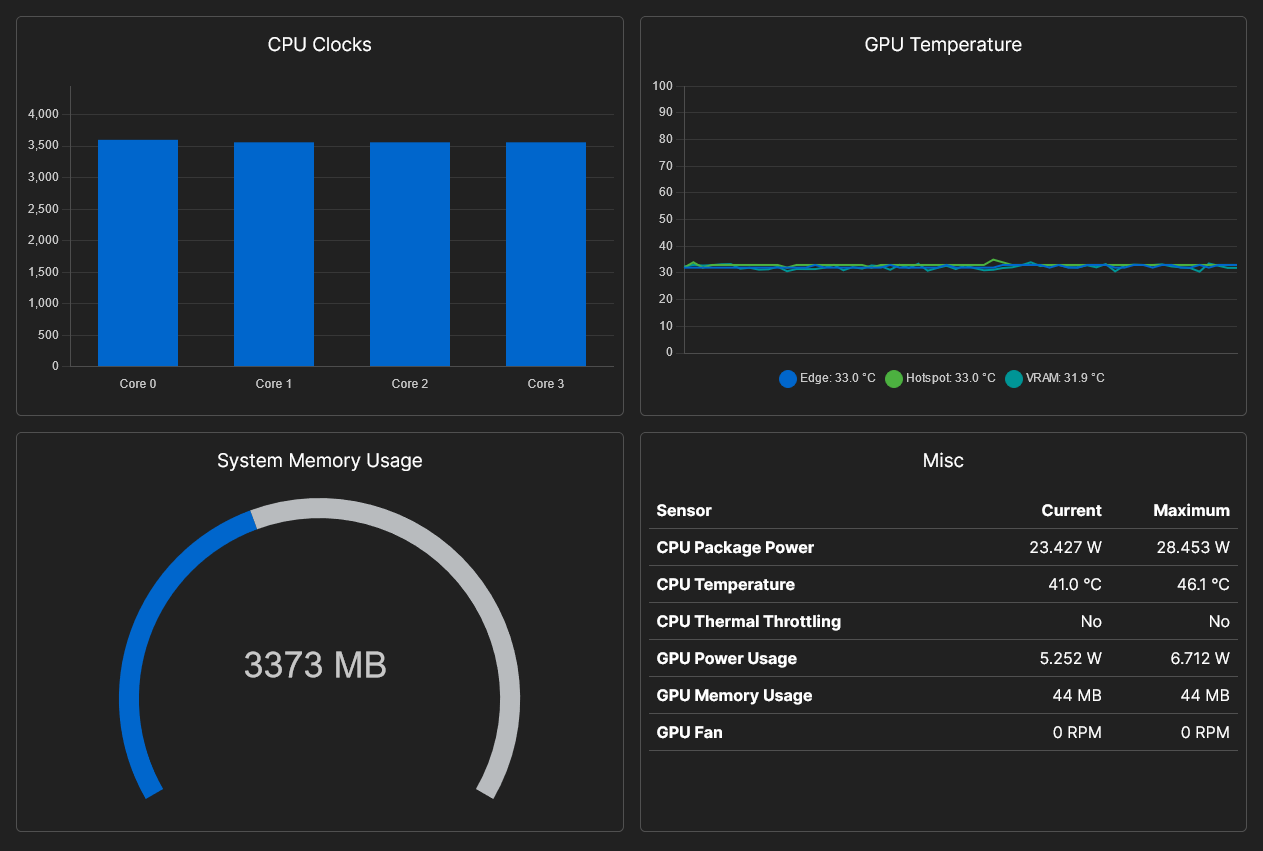
Jonitor is a web application for displaying real time hardware information in tables and charts. It can be used to monitor a computer from any devices as long as the devices support running a modern web browser.

Features
Run Jonitor
Configure Jonitor
The following options can be changed in
Download Jonitor
Download the latest version from GitHub. The source code can be found in the same repository.
Post your questions, bug reports and suggestions below or in the GitHub repository. Please note that I don't intend to add too many customization options to Jonitor as it is not a replacement for other well established dashboards like Grafana dashboards.

Features
- Show hardware information in bar charts, line charts, gauge charts and tables (as shown in the image above). There is also a "Tables" view that shows all sensors, just like the HWiNFO Sensors Status window.
- Build and save custom dashboards containing any data from HWiNFO. Dashboards can be configured to be responsive to look better on different devices (phones, tablets, etc). Switching between light and dark mode are also supported.
- Easy to setup and use -- less than 1 minute to get Jonitor up and running.
Run Jonitor
- Download Jonitor and unzip the files to a folder.
- Run HWiNFO in "Sensors-only" mode with "Shared Memory Support" enabled.
- Run
jonitor.exe. - Open a web browser and navigate to http://127.0.0.1:10110.
Configure Jonitor
The following options can be changed in
config.json:ip- The IP address to bind to by Jonitor.port- The port to listen on by Jonitor.polling_interval- The interval in milliseconds is the frequency at which Jonitor reads data from HWiNFO. The interval must be at least 1000 milliseconds.
--close-on-error, is available to close Jonitor immediately when an error occurs. When this flag is not set, Jonitor waits for the Enter key to be pressed before closing, so the error message can be seen.Download Jonitor
Download the latest version from GitHub. The source code can be found in the same repository.
Post your questions, bug reports and suggestions below or in the GitHub repository. Please note that I don't intend to add too many customization options to Jonitor as it is not a replacement for other well established dashboards like Grafana dashboards.
Last edited:


