Adeptivity
New Member
tldr : experiencing high temp spikes for both cpu/gpu. would appreciate further explanation regarding what the sensors measure and how to interpret their values from the screenshots provided below; trying to figure out if pc just doesn’t have sufficient cooling and needs more fans, if cpu/gpu needs to be undervolted, or if there's something deathly wrong with my rig. thank you in advance for any help. ( i do apologize if everything below is too long too read)
Hello,
Lately I've noticed my CPU and GPU have been spiking at pretty high temperatures, and I'm trying to determine if these temperature are still considered normal, or if I should actively take steps to address this as a serious issue. Right now the next step is to either potentially undervolt my CPU and GPU or maybe just install more fans. However before I do either I wish to eliminate the concern that there may be any other underlying issues.
A few months ago I started to notice my GPU was running really hot at significantly high temperatures (encroaching on 90°C+). I quickly discovered the GPU fan had actually died, but thankfully I was able to replace the fan and my GPU has been okay since. However as of late I'm now noticing that both my GPU and CPU seem to be spiking at very high temperatures and it makes me suspect there may be another underlying cause. After replacing the fan in my GPU I've been using HWInfo to closely monitor fan RPMs and the temperature readings of both the CPU and GPU. I know a good idle temp is usually 40°C - 65°C, and for heavy loads it can reach as high as 80°C, but when under a heavy load it seems that they're always running higher at 80°C+ . The CPU temperature readings have consistently gotten so high it's triggered some alerts that have become highlighted in red within HWInfo. As a result I believe I've also experienced frame rate stuttering while gaming as well.
I've also noticed that when my PC starts to take on heavy loads specifically from gaming the fans are very slow to ramp up in speed, which I suspect may be attributing to such high temperatures. The motherboard doesn't have the option to manually adjust fan curves so I've been learning to use Fan Control to compensate (which is amazing btw). Creating a new fan curve has definitely helped to keep the temperature readings a lot lower, but I'm afraid I've been forced to use such an aggressive fan curve to counter such high temperatures that this may instead lead to excessive wear and tear on my fans.
I believe the quickest and easiest solution is to install additional fans/improve cooling. However, I'd hate to assume that fixes the problem when there could still be an underlying issue. I also suspect there may be a sensor that may not be picking up temperature correctly, but I wouldn't know where to begin to even diagnose that. My next step is to attempt Undervolting, but I wanted to use HWInfo to understand the sensor readings a little better to see if that's necessary. After the scare of having to replace the fan in my GPU I want to stay ahead of any significant issues, and become better at keeping up with the maintenance of my PC.
Unfortunately I'm still a bit new to using HWInfo and don't fully understand the meaning of all the sensors or how to interpret their values. If anyone could help me breakdown what these readings mean and if it can potentially help me figure out the problem and the next best step.
Since I was concerned about running my fans at such high speeds for long periods of time I temporarily stopped using my custom Fan Curves from Fan Control to give them a break; so these values are from the default Fan Curve set by the Motherboard/BIOS that I am unable to change.
These readings are from the past 3-4 days from heavy gaming combined with moderate idle time. The CPU readings are what I’m most concerned about especially since 100°C is a danger zone where I know you start to encounter throttling or possibly complete failure. HWInfo sends alerts by default at 100°C, but I lowered it to 85°C so that I can receive sound alerts and adjust fan speeds accordingly if needed. I'm really concerned about the columns that say Yes since I don't fully understand what those values imply.
Please let me know if there's any additional information I can provide. I just really want to learn how to better understand the sensor readings from HWInfo and how to interpret their values. From there I'm hoping this will help me decide if needed, the next best steps.
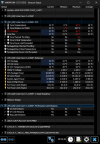
I generally try to monitor the temperatures for the sensor directly embedded in the CPU under CPU Package. So far it seems to be consistent with any other external sensors. Since I'm still learning I really want to understand the sensor values regarding power and how that may relate to Undervolting.
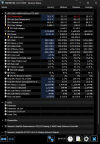
Here are the GPU sensor values that I will usually monitor. Again any info about understanding the sensor readings regarding power is greatly appreciated.
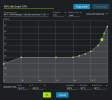
This is the fan curve that I usually try to maintain where I try to keep it at 40% while it's idle. Once it starts to exceed idle temps at 65°C is when its set to ramp up to higher fan speeds. I have the fan curve set to changed based on CPU Package where it reflects the core with the highest temperature. It feels a bit more effective compared to when I previously had it set to just the CPU Cores Average temperature, but I'm not completely sure since I've still experienced high temperature spikes with both.
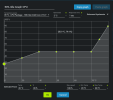
If I start to receive alerts for HWInfo or notice temps are significantly higher without change, I'll resort to this more aggressive curve. It is significantly more effective in that it prevents higher spikes in temperature, but I feel like it's a bit too aggressive and will reduce the lifetime on my fans if I rely on it as often as I do.
From what I've read online I've heard a lot of recommendations about using MSI AfterBurner along with benchmarks to narrow down the issue or diagnose a particular problem, which I have downloaded and used. However since I'm still learning I'm just not sure what to look for and how to read the values. Since I don't have the intent to overlock at this time, I greatly prefer HWInfo especially since it provides so much more in depth information & monitoring that a lot of other apps use as well. I know for a fact the higher temperatures are definitely associated with heavier loads while gaming (which I know is considered normal) but I'm still convinced the temperature readings are bit higher than they should be. When idle the temperatures are typically consistent between 30°C to 45°C which is a good sign, but since I spend most of my time gaming on the rig I'd really like to make sure I can identify the issue if there is any.
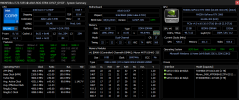
Here is also my system summary if that helps as well. I chose this particular build specifically for the i7 processor and the 16GB of ram. I always had in mind that eventually I would end up swapping out all the other parts to upgrade, but the build is barely a year old so I didn't think I would have to do such so soon. I've always been skeptical about the motherboards in prebuilds since you technically don’t know what you're going to get, and they definitely tend to skimp on other parts. The GPU where the fan died, I've learned is the budget model (it only has one 1 fan???), and is known to have that happen as a very common issue. I've always been a big fan of ASUS (I previously had an ROG Gaming Laptop with similar specs that's still running 9 years later), but I feel like the B660 Motherboard and the RTX 3060 Phoenix are definitely lacking compared in what they have to offer. However I can say those are the only two complaints I have about the build so far.
Hello,
Lately I've noticed my CPU and GPU have been spiking at pretty high temperatures, and I'm trying to determine if these temperature are still considered normal, or if I should actively take steps to address this as a serious issue. Right now the next step is to either potentially undervolt my CPU and GPU or maybe just install more fans. However before I do either I wish to eliminate the concern that there may be any other underlying issues.
A few months ago I started to notice my GPU was running really hot at significantly high temperatures (encroaching on 90°C+). I quickly discovered the GPU fan had actually died, but thankfully I was able to replace the fan and my GPU has been okay since. However as of late I'm now noticing that both my GPU and CPU seem to be spiking at very high temperatures and it makes me suspect there may be another underlying cause. After replacing the fan in my GPU I've been using HWInfo to closely monitor fan RPMs and the temperature readings of both the CPU and GPU. I know a good idle temp is usually 40°C - 65°C, and for heavy loads it can reach as high as 80°C, but when under a heavy load it seems that they're always running higher at 80°C+ . The CPU temperature readings have consistently gotten so high it's triggered some alerts that have become highlighted in red within HWInfo. As a result I believe I've also experienced frame rate stuttering while gaming as well.
I've also noticed that when my PC starts to take on heavy loads specifically from gaming the fans are very slow to ramp up in speed, which I suspect may be attributing to such high temperatures. The motherboard doesn't have the option to manually adjust fan curves so I've been learning to use Fan Control to compensate (which is amazing btw). Creating a new fan curve has definitely helped to keep the temperature readings a lot lower, but I'm afraid I've been forced to use such an aggressive fan curve to counter such high temperatures that this may instead lead to excessive wear and tear on my fans.
I believe the quickest and easiest solution is to install additional fans/improve cooling. However, I'd hate to assume that fixes the problem when there could still be an underlying issue. I also suspect there may be a sensor that may not be picking up temperature correctly, but I wouldn't know where to begin to even diagnose that. My next step is to attempt Undervolting, but I wanted to use HWInfo to understand the sensor readings a little better to see if that's necessary. After the scare of having to replace the fan in my GPU I want to stay ahead of any significant issues, and become better at keeping up with the maintenance of my PC.
Unfortunately I'm still a bit new to using HWInfo and don't fully understand the meaning of all the sensors or how to interpret their values. If anyone could help me breakdown what these readings mean and if it can potentially help me figure out the problem and the next best step.
Since I was concerned about running my fans at such high speeds for long periods of time I temporarily stopped using my custom Fan Curves from Fan Control to give them a break; so these values are from the default Fan Curve set by the Motherboard/BIOS that I am unable to change.
These readings are from the past 3-4 days from heavy gaming combined with moderate idle time. The CPU readings are what I’m most concerned about especially since 100°C is a danger zone where I know you start to encounter throttling or possibly complete failure. HWInfo sends alerts by default at 100°C, but I lowered it to 85°C so that I can receive sound alerts and adjust fan speeds accordingly if needed. I'm really concerned about the columns that say Yes since I don't fully understand what those values imply.
Please let me know if there's any additional information I can provide. I just really want to learn how to better understand the sensor readings from HWInfo and how to interpret their values. From there I'm hoping this will help me decide if needed, the next best steps.
I generally try to monitor the temperatures for the sensor directly embedded in the CPU under CPU Package. So far it seems to be consistent with any other external sensors. Since I'm still learning I really want to understand the sensor values regarding power and how that may relate to Undervolting.

Here are the GPU sensor values that I will usually monitor. Again any info about understanding the sensor readings regarding power is greatly appreciated.

This is the fan curve that I usually try to maintain where I try to keep it at 40% while it's idle. Once it starts to exceed idle temps at 65°C is when its set to ramp up to higher fan speeds. I have the fan curve set to changed based on CPU Package where it reflects the core with the highest temperature. It feels a bit more effective compared to when I previously had it set to just the CPU Cores Average temperature, but I'm not completely sure since I've still experienced high temperature spikes with both.

If I start to receive alerts for HWInfo or notice temps are significantly higher without change, I'll resort to this more aggressive curve. It is significantly more effective in that it prevents higher spikes in temperature, but I feel like it's a bit too aggressive and will reduce the lifetime on my fans if I rely on it as often as I do.

From what I've read online I've heard a lot of recommendations about using MSI AfterBurner along with benchmarks to narrow down the issue or diagnose a particular problem, which I have downloaded and used. However since I'm still learning I'm just not sure what to look for and how to read the values. Since I don't have the intent to overlock at this time, I greatly prefer HWInfo especially since it provides so much more in depth information & monitoring that a lot of other apps use as well. I know for a fact the higher temperatures are definitely associated with heavier loads while gaming (which I know is considered normal) but I'm still convinced the temperature readings are bit higher than they should be. When idle the temperatures are typically consistent between 30°C to 45°C which is a good sign, but since I spend most of my time gaming on the rig I'd really like to make sure I can identify the issue if there is any.
Here is also my system summary if that helps as well. I chose this particular build specifically for the i7 processor and the 16GB of ram. I always had in mind that eventually I would end up swapping out all the other parts to upgrade, but the build is barely a year old so I didn't think I would have to do such so soon. I've always been skeptical about the motherboards in prebuilds since you technically don’t know what you're going to get, and they definitely tend to skimp on other parts. The GPU where the fan died, I've learned is the budget model (it only has one 1 fan???), and is known to have that happen as a very common issue. I've always been a big fan of ASUS (I previously had an ROG Gaming Laptop with similar specs that's still running 9 years later), but I feel like the B660 Motherboard and the RTX 3060 Phoenix are definitely lacking compared in what they have to offer. However I can say those are the only two complaints I have about the build so far.

Last edited:
