Question for Auto logging and saving file.

K2style

Member
Forgive me and my ignorance. I am trying to use HWiNFO, and I'm wondering if I can with the free or purchased version somehow have this auto start and save the csv file after the desired time has been met. I see there are API commands and someone I know said I could probably create something via python. That is a little bit over my head, so does this make sense what I'm asking? Short and sweet I want HWinfo to open lets say at 6:00pm log all night and collect sensor data of my machine and then save and close creating the log for me at 6am. If anyone can shed some light on this I would be very thankful. Thanks for your time.
 
This can be done only with HWiNFO64 Pro which supports command-line arguments to automatically create log files upon start.
To schedule the start (and termination) I'd recommend to use Windows Task Scheduler (integral part of Windows). This is intuitive and gives you plenty of options how/when to start and run a program/task and doesn't require any programming skills.
 
OK great will get that version to assist in this, another question I have noticed with a mother board that has 2 CPU's that on the 2nd CPU I am not getting a temperature for that 2nd CPU is this limited by features because I'm using the free version? Then a co worker just came by and said If I am using a add on occulink card, that contains additional hard drives that are not directly in line to the motherboard. He does not see those additional hard drive temperatures either, it detects them but does not report the temps. We will most likely purchase the corp version so we can use this along side testing we do. Thanks for the help.
 
I cannot comment on that without knowing more details - screenshot of the problematic values, HWiNFO Report File, Debug File..
 
Ok, I ran a short debug for the motherboard with 2 CPU's It shows the Core temps as CPU#0 and CPU#1 both show core temps but CPU p1 as a whole is the only one that shows a temp. Should there also be a P2 or P0 CPU? I am not sure. I do have the debug file of a short recording if you want it, i would just need to know where to upload it.
 
Yes, of course I need that file. Currently I don't even know what CPUs are you talking about.
 
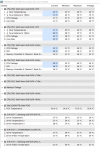
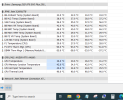
Ok, sorry about all this and thank you so much for your help and patience with me. I think what's going on with the technician asking me is this is just confused by the readings. I'm new at this and learning obviously but I think basically they don't know how to use this and don't know what all the readings are or mean. So the main goal I'm trying to help with here is to record the max temp of the CPU's of the test setup they are running. I think there are just to many sensor readings and they are getting confused. So I took some screen shots to hopefully understand what things mean. For this setup the board is s2600 STB with 2 CPU's I asked it to only show me the temps and disabled most other things that I don't think I need just yet. Is the CPU package what I should be looking at to get these max temps? I see Intel on the screen capture PCH also shows a temp but there is only one value listed and 2 CPU's. Also in the screen capture IPMI there is a CPU P1 temp listed. Which one gives me the max value of the CPU's.
 

Attachments

  • Annotation 2023-03-17 144050.png
    Annotation 2023-03-17 144050.png
    80.9 KB · Views: 8
  • Annotation 2023-03-17 144121.png
    Annotation 2023-03-17 144121.png
    66.7 KB · Views: 8
Yes, the "CPU Package" should be the main value to watch for each CPU.
PCH is the chipset and there's only one on the entire mainboard.
 
Back
Top