Timer on Sensors screen not updating in real-time (even if set to 1,000 ms) - deliberate feature?

PiersJH

Well-Known Member
The timer at the bottom right of the Sensors screen no longer updates in real-time. The only change I've made is to enable SVM/virtualisation in the BIOS. This problem seems to occur sporadically, but is almost-always reproducible when running the CoreCycler script (which only uses 1 thread at a time), with HWiNFO reporting CPU utilisation < 5%.

This occurs on at least versions7.17-4660 up to 7.2, including betas in-between releases. I've only used the Sensors Only mode.

I've tried
  • Updating to the latest version
  • Resetting all HWiNFO settings
  • Removing HWiNFO entirely and reinstalling
  • Closing other software/services that might be polling the same sensors (Afterburner, Corsair iCUE, etc.)
  • Enabling Profiling Time and disabling monitoring of devices with a higher value than 0. This included two SATA HDDs (but not SATA SSDs) with a reported value of ~14 / A Corsair/CoolIt CLC with a reported value of ~10 / An EVGA RTX 3080 with a reported value of ~12.
  • Disabling HWiNFO from accessing/supporting Corsair & Asetek products
  • Disabling devices one-by-one to see which might be the cause, but that doesn't seem to help.
  • Changing polling time/period options from the default 2,000 (Global) | 100 (SMART) | 1 (Embedded Controller), which stops the timer from displaying second in real-time, to options that have worked for years; 1,000 (Global) | 1,500 (SMART) | 1 (Embedded Controller
  • Switching between Snapshot CPU Polling and the default method - this seems to make a small difference (enabling Snapshot CPU Polling), but there's no obvious pattern.
Description of Behaviour
The real-time timer at the bottom right of the Sensors window sometimes ticks second by second ((when set to 1,000 ms global), every 2 seconds (which I believe is the new default behaviour), or now most commonly it can tick by with seemingly random number of second - sometimes a delay of only 3-4 seconds, there will be a delay of up to 10,000 ms on occasion (that I've noticed).

This is despite changing global polling period. When enabling Profiling Time to see if there are any devices that have suddenly stopped working correctly, only a few show any delay at all (under 20 ms) with the rest showing a solid 0.

My next idea is to try HWiNFO v6.x portable to see if that changes anything. Apart from that, does anyone have any ideas as to what the cause could be?
 
Such sporadic updates to the timer could mean that reading some of the sensors is taking excessive amount of time or something else in the system is blocking HWiNFO's threads or its GUI. This could also be caused by running some high load on the system and in such case raising HWiNFO's priority via Task Manager could help.
 
Such sporadic updates to the timer could mean that reading some of the sensors is taking excessive amount of time or something else in the system is blocking HWiNFO's threads or its GUI. This could also be caused by running some high load on the system and in such case raising HWiNFO's priority via Task Manager could help.
Thank you for such a quick reply. I can't work out why reading the sensors would be taking longer. This happens at idle as well. However, I've just opened CoreCycler and it's saturating one thread (not core). The updates were happening about every 18,000 ms! I changed priority to Normal and that made no difference. I then changed the priority to High and it started to report every 2,000 ms, as it's meant to.

Would generating some form of log be helpful?
 
No need for that as the situation is clear now.
HWiNFO polls all CPU threads in each cycle to gather some status information. Even though such queries might be minimal, when there's another task overloading any system thread, the Windows scheduler will stall all other threads (of same or lower priority) attempting to run on this CPU thread. This results in delayed results in HWiNFO, but is normal operating system behavior that can be solved by adjusting priority.
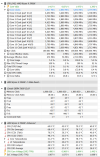
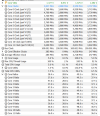
After observing the timer, with setting the priority as High, it's ticking over between 2,000 ms (as it should be), and 9,000 ms (which it shouldn't be). I've also noticed the new version of HWiNFO has odd clock reports in both the standard mode and Snapshot CPU Polling. BCLK is 100.001 and RAM is 1,800.020, but the multiplier is reported as quite odd figures I've not seen before (second screenshot). This CPU is at stock, apart from XMP enabled and therefore 1:1.

What's your view on that information combined?

1647858164356.png

1647858325701.png
 
The problem seems to be the large delay. Previous versions of HWiNFO never required setting a higher priority, even with Prime95 small FFTs HWiNFO would update every second.
 
Sorry, but I fail to spot a problem here.
I believe I've found a fix for whatever the problem is. I tried most versions of HWiNFO64 going back to 7.16-4650. This version appears to be fine. And just to be sure, I uninstalled the version I was using - again - but this time also manually removed the Program Files directory, as well as the files HWiNFO64 leaves left in %temp%., such as the drivers (why aren't those removed when uninstalling?).

However, the major issue I faced with newer versions - especially upgrading from the 717 beta to 7.20 - is not the timing issue I've already mentioned (I'll remain adamantly positive that I've not seen behaviour in the 10+ years I've been using HWiNFO...), but the entire HWiNFO sensors window flashes and freezing.

As far as I'm aware, that's very typical behaviour (not common) when HWiNFO is trying to read sensor information but it's not working correctly for whatever reason. Even the cursor froze for about a second or two, which is not due to XMP being enabled (no other overclock). Performance when closing HWiNFO64 7.20 returned to normal, so it really does seem to be a sensor issue. I noticed that 7.20 introduces support for the NCT6799D - I have the NCT6798D and perhaps that's part of the problem?
 
Back
Top