Additional S.M.A.R.T Features

PantherX

Member
First off, I really like the interface of your application and it contains nearly all the data about my system. However, I would like the following to be included:

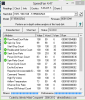
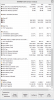
1) S.M.A.R.T. Status -> By this, I mean the overall health of the disk which is Good or Bad. It would be nice since I was lucky to run CrystalDiskInfo and detect that one of my external disk was Bad and managed to get the data off it before it died :)

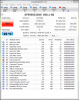
2) S.M.A.R.T Scan for external disks -> I have 3 external disks connected via USB 2.0 and the S.M.A.R.T. values are shown in Speedfan (4.47) and in HWMonitor (1.19) so is there a reason that HWiNFO (4.10) isn't showing them up? I am just interested in the operating temperatures and not the entire data set.

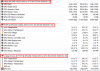
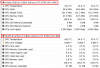
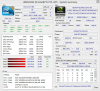
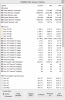
3) Missing S.M.A.R.T. Scan for SSD -> I have an Intel 520 SSD 240 GB and it doesn't show in the Sensor scan but shows up in the summary scan. I am not sure why since I read the Known Issues thread and am using the latest Intel RST Driver which is 11.7.0.1013 and have the Chipset Drivers installed too. The Sensor shows the other HDD correctly so am not sure what the issue is.

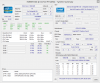
I do have a question as to why in the sensors scan, my Nvidia GPU shows up thrice on my Desktop and twice on my laptop. Instead, can't it all be grouped under one?

Please note the following:
HWiNFO64 (Desktop) -> Points 1 & 2
HWiNFO64 (Laptop) -> Point 3

Thanks
 

Attachments

  • HWiNFO64 (Desktop).DBG
    444.6 KB · Views: 3
  • HWiNFO64 (Laptop).DBG
    421.2 KB · Views: 4
  • GPU (Desktop).PNG
    GPU (Desktop).PNG
    47.7 KB · Views: 28
  • GPU (Laptop).PNG
    GPU (Laptop).PNG
    37.6 KB · Views: 20
Thanks for your suggestions, here are my answers:
1. I'm not sure how to exactly decide whether the status of drive is good or bad. I've have seen all sorts of SMART data being reported and it seemed to me that some drives simply don't return what they would be expected to return and others reported all OK and then suddenly died. Do you maybe know which SMART parameters should be evaluated and their weight determining overall drive status? If I would have the required knowledge, I could include reporting of such status in % in sensors.

2. Since I already got more such requests, I'll put this request into my to-do list.

3. Does the SSD drive show SMART data (including temperature) in the main HWiNFO window under drives ?

Those various entries denote which particular sensor is being reported, so it's grouped by sensor and not by GPU. For example on the first picture, the first sensor values come from internal sensors, the second from NVAPI interface and third shows values from an auxiliary GPU sensor. I understand that it might be confusing to see 3 entries per a single GPU and from logical point of view they all should be aligned under a single GPU section. However changing the current design of how sensor values are being processed and reported by HWiNFO would break settings for all users that have already setup their particular monitoring configuration. I also think that the sensors window needs a major redesign to cope with the growing amount of different sensors present. So I have some ideas how to completely redesign the entire sensor reporting, but I still haven't finished this and I'm still reconsidering what would be the best way...
 
Update:
I'm making research how to report some kind of overall drive health status and I hope to come to a solution... This would then be also available via sensors for real-time monitoring.
 
Thanks for the information Martin!

1) I have attached screenshots from CrystalDiskInfo and SpeedFan along with the detailed report of the bad disk here for you to view. I did a quick research and according to Wikipedia, there are some known attributes which can help you predict the failure of the disk and the list is here. My suggestion would be a "simplistic" approach (Not sure of the actual method, just guesswork) similar to CrystalDiskInfo. I believe that the overall health status is determined by seeing if any value if below the threshold, if so, the drive is marked as bad. If not, then the drive is good. An enhancement to this method is the ability to select which sensors are monitored. Maybe a list of all are presented and users can uncheck the ones that they don't want to be monitored and the overall heath is determined from the checked ones.

2) Thank you very much :)

3) My SSD isn't detected at all under the Sensors and I have attached screenshots.

Thanks for the explanation. Am looking forward to the new design whenever it's ready :)

If possible, could you implement an auto re-size of the columns in the Sensors view so I can see the full names of the devices instead of manually adjusting each one?

Furthermore, in the screenshot for Laptop Summary, I noticed that the CPU clocks are 0 MHz but I am actually running F@H and according to Task Manager, the load is 100% and the CPU speed is 3.39 GHz so am not sure if that's a bug or not. I have included a screenshot of my desktop and it shows the CPU clocks correctly. Can you please look into this to see if the issue is of my laptop or not? Am happy to help you if needed
 

Attachments

  • CrystalDiskInfo.PNG
    CrystalDiskInfo.PNG
    100.4 KB · Views: 15
  • SpeedFan.PNG
    SpeedFan.PNG
    21 KB · Views: 14
  • Sensors (Laptop).PNG
    Sensors (Laptop).PNG
    72.4 KB · Views: 15
  • Summary (Laptop).PNG
    Summary (Laptop).PNG
    78.5 KB · Views: 13
  • Summary (Desktop).PNG
    Summary (Desktop).PNG
    66.8 KB · Views: 18
Actually, HWiNFO displays a warning sign next to a SMART value which crosses the allowed threshold. So you should see such a situation in HWiNFO too. It's just not displayed in sensors, because I don't know how would I display such a condition there. It would not be useful to display all SMART values in the sensor screen, also the question is how would I represent it there?..
As for most SSD drives this seems to be easy and I already found methods how to display the percentage of life. It will just take some time until I implement this.

As for the 0 clock on your notebook, I think this is somehow related to Windows 8. Can you please check if the same problem appears when the machine is idle, or under different conditions? Just to let me know whether this is a constant behavior.. I got the DBG file from this machine, so I'll check that...
 
For the SMART, how about in the Sensors, you display the Status only when it is good. If it is bad, then only display that value which is above the threshold? Alternatively, by default, all values are hidden except the overall status but the user can configure which values are displayed by using the configure option. If you want, I can create a mock-up interface to help illustrate my point better.

I restarted my laptop without F@H, it still displays 0 Core Clocks but the Ratio does change and the load was 0% to 10% according to Task Manager. Moreover, the Sensors do report the Core #0 Clock. I did notice that for a second or so, it displays 0.00 MHz in the Current value and proper values in the Min and Max so I am not sure why that it is. I have attached a screenshot to help you.
 

Attachments

  • CPU Clock (Laptop).PNG
    CPU Clock (Laptop).PNG
    64.6 KB · Views: 13
Yep, that was one of my ideas. But because of the way how the sensors work currently, I'll probably display Drive Health status for drives which report this (certain SSDs) and overall status/failure for others based on threshold.

It seems a certain timer used to calculate CPU clock is not working properly on some Windows 8 systems. Are you maybe running some other system monitoring/management tools in parallel? Or any special applications? If yes, please try to close them to see if that might be the cause and let me know the result.
 
The laptop has Windows 8 64 bit Pro installed and that screenshot was taken after a fresh reboot and no other system monitoring application was running. Just the normal drivers and applications that started at boot time. I rebooted my laptop and this time disabled F@H and HFM.NET and I still get that 0.00 MHz issue.
 
I have probably found the cause of the clock=0 issue. This requires a bit effort to fix it... I'll post here a build for testing soon.
 
Please try this build:
www.hwinfo.com/beta/hw64_411_1845.zip

I have added:
- Monitoring of overall SMART status (Failure) based on threshold values. This is now available in the sensors screen.
- Reporting and monitoring of SSD drive health status in %. Available in main window and sensors too.
- I have tried to fix the 0 MHz clock problem, but it needs to be tested if it's OK.

Please check all those points and let me know how it works...
 
Martin said:
Please try this build:
www.hwinfo.com/beta/hw64_411_1845.zip

I have added:
- Monitoring of overall SMART status (Failure) based on threshold values. This is now available in the sensors screen.
- Reporting and monitoring of SSD drive health status in %. Available in main window and sensors too.
- I have tried to fix the 0 MHz clock problem, but it needs to be tested if it's OK.

Please check all those points and let me know how it works...

I get a remaining life percentage for my Crucial M4 SSD, and a Drive failure status for all 5 hard drives now in sensors. All drives are internal. Nice job!

- Nick
 
Martin said:
Thanks for the feedback Nick. Does all information seem to be correct?

Its 100% on the remaining life, and "No" for all 5 drive failures....so yes, looks good to me.

However, I need to go back and check my apps. When we did the sidebar gadget, we decided to excluded any readings with a yes/no unit label. At the time, the chassis intrusion state was the only sensor with this unit. So now I need to check that.

The Shared Memory viewer used for extracting IDs for Rainmeter show 0 as a value. I assume it will show a 1 if it is a 'Yes'? I need to check this in the Rainmeter plugin as well.
 
There are already more values of this type - CPU Thermal Throttling status too.
 
Martin said:
There are already more values of this type - CPU Thermal Throttling status too.

Thanks Martin.

After a quick test:
Sidebar Gadget - The 100% remaining life for the SSDs shows properly as it is a percentage reading. None of the Yes/No values show. I'm not sure it even worth updating as the sidebar is phasing out and its only a few readings that would be added.
Rainmeter - The remaining life is fine. And all yes/no values show a 0 for no and 1 for yes. So this is working properly already - no changes needed.

I'll start the update for the Rainmeter plugin names shortly. I need to spin up a Win7 virtual machine for the older version of Visual Studio. 2 months ago when I switched to Win8/VS2012, I opted not to multi-boot my machine anymore.
 
Thanks for the rapid update. I tested it and the results are as follows:

1) SMART Status
- Internal HDDs in my desktop and laptop shows up fine
- Internal SSD in my laptop shows only in the summary view and not in the sensors view
- External HDDs attached to my desktop didn't show up in the summary nor the sensors

2) CPU Speed is now correctly detected in the Sensors and Summary

I have attached screenshots and debug information from my laptop. Hope that it helps in the debugging process.
 

Attachments

  • HWiNFO64 (Laptop).DBG
    629.7 KB · Views: 1
  • Laptop Sensor.PNG
    Laptop Sensor.PNG
    64.3 KB · Views: 7
  • Laptop Summary.PNG
    Laptop Summary.PNG
    80.4 KB · Views: 10
Thanks for the feedback. I'm happy that the clock works now.
Could you please attach a HWiNFO Report File (which can be generated from the main window). In case you run HWiNFO in Sensor-only mode, you need to disable it to get the main window. I need this to check if the SSD drive is properly recognized and displays correct SMART information in the main window (under Drives).
 
Please find attached the report that was generated. It took me some time to figure it out since I always thought that HWiNFO can run in only Sensor or Summary views which should be selected at start-up. I did see that the SSD was detected and the SMART values were correctly displayed including the remaining life.

Moreover, a rather minor bug might be there since I can't get the report window to the foreground since the Summary window is on top of it even when I shift the focus to the Report view. I have attached a picture.

EDIT -> I can't attach any file and am not sure what the issue is :/ The URL is http://www.hwinfo.com/forum/editpost.php?pid=3464&processed=1 and the site displays a 0 in the upper left corner and the entire screen is a blank white page. I am using Cyberfox 18.0.1 (a 64 bit variant of Firefox)
 
Ah, that is a problem with the forum I had already reported. I forwarded it to forum development team, but haven't got a response yet.
Packing the attachment (ZIP, RAR, etc) should fix it.
Nevertheless, I think I know why your SSD is not displayed in sensors - it's because it doesn't have a temperature sensor and only drives reporting temperature were included in sensors. Now I'll fix this, so your drive will report it's health status in sensors. However, temperature can't be reported.
 
Okay, thanks for that. I have now attached it as a .zip file for you to view.

You are correct, I didn't see any temperature data under the SSD but it was there under the HDD.
 

Attachments

  • Attachments.zip
    359.4 KB · Views: 2
Back
Top