AMD RX 6900 XT sensor readings

Nerevar

Member
Hello,

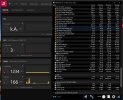
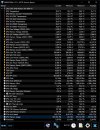
I'm quite confused with some sensor readings HWInfo shows since a few updates (HWInfo and AMD drivers) ago. Please have a look at the attached screenshot:
Zwischenablage01.jpg
  1. GPU ASIC Power seems to be far to high. My RX 6900 XT card (PowerColor Liquid Devil Ultimate) is set to a PPT limit of 381 Watts, as shown under GPU PPT Limit. The GPU ASIC Power shows maximum values close to 500 Watts, sometimes peaks over 500 Watts are recorded. I'm aware, that graphic cards do speak significant above the official PPT. But aren't those peaks normaly to fast to be recorded by software? Are these correct values or bugs?
  2. The GPU Memory Clock should be constant at 2.000 MHz under load. I don't overclock anything, neither manualy nor via AMD drivers. I only raise the PPT to the maximum +15%. I have no clue, why the memory clock is such dynamic. I'm not aware of any GDDR6 capable of such frequencies. These readings can't be correct.
  3. The GPU Memory Usage shows values of 600.000 MB... what?

Last... the new dark theme looks really good. When I open a new sensor window or change the window length, the scroll bar on the right side dissapears or is shown in black. After scrolling the sensors via mouse wheel, the scroll bar appears. Is that a bug already known to you?

Regards
Torben
 
GPU ASIC Power is a value reported by the GPU drivers API (ADL) and we believe this is broken in recent driver releases. Other values like PPT or TGP are reported internally by the GPU and should be correct. These values are available in HWiNFO only and AFAIK all other tools including Radeon Software report the (broken) ASIC Power.

GPU Memory Clock is broken in many recent driver versions and a known issue also listed in Radeon Software release notes.

The scroll bar used in Dark Mode is a standard behavior in Windows. Such appearance will be even more apparent in Windows 11.
 
Hello Martin,

an what about the GPU Memory Usage? To be clear, 600.000 (the "." seperates thousands in Germany) means 6/10 of a million Megabytes. My card only has 16.384 MB available. Or is the virtual memory allocated meant? Even that would be a ridicolous value.

Regards
Torben
 
It means 600 MB, the default decimal separator used in HWiNFO is English ".". You can change this in sensor settings.
 
nope... I changed my default thousands and decimal seperators in the general settings. The GPU Memory Usage value is configured to "0" decimal digits. That's means HWInfo shows me 600-thousand MB of used GPU memory.
 
Then it's a bug in the graphics driver as well, this value is provided via the same interface as GPU ASIC Power.
 
Radeon Software Adrenalin 21.10.1 lists the problem with reporting of power consumption as fixed, so you might give it a try.
Fixed Issues:
On full GPU load, Radeon™ Software may incorrectly display higher than actual GPU power consumption values.
 
Hello Martin,

I tested the new driver today. The GPU ASIC Power seems to be correct, it's almost identical to the GPU PPT :thumbsup:

The GPU Memory Usage is still ridicolous. Me new record are over 1 million Megabytes. The Memory frequency is still bugged aswell.

Regards
Torben
 
Zwischenablage01.jpg

comparing the memory usage in the drivers metrics tab an the HWInfo64. Those numbers don't match. If HWInfo only reads the values by the driver, why do they diverge so much? 1.234 MB is not equal 136.187 MB.
 
yes, the AMD "memory usage" (mine is shown in German as "Auslastung" in the driver tab) matches perfectly the D3D Memory Dedicated in HWInfo.

Shouldn't be the GPU Memory usage simply be the sum of dedicated and dynamic VRAM usage?
 
GPU Memory Usage comes straight from AMD drivers via ADL, but the fact that their own software prefers the D3D interface instead indicates they don't trust their own ADL interface.
 
resurrecting an old thread...

the new 22.7.1 AMD Radeon drivers no longer list under "Known Issues"
Radeon performance metrics and logging features may intermittently report extremely high and incorrect memory clock values.

any information, whether this bug has been finally fixed or has AMD simply stopped listing this bug?
 
got a little problem with my GPU sensors on my RX 6900XT. For whatever reason I cannot seem to get any data out of them. I tried to go for radeon-profile and CoreCtrl. CoreCtrl shows a [GPU 0] but every sensor shows 0 MHz / 0 W / 0 % except “Used memory”. radeon-profile doesn’t even get my GPU at all and crashes when I refresh in order to look for devices.

Sorry, but how is this related to HWiNFO?
 
Back
Top