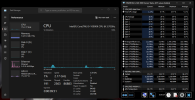
IMPORTANT Core frequency reading in Windows 11

That and the P-core clocks reading as 55/60/60/60/60/59/59/59 while turbo max restrict them to 60/60/59/58/57/56/55/55. At no time does the CPU concurrently clock 4 cores to 60x + 3 cores to 59x, so the HWinfo readings are way off. I assume that these are the last values before entering C6 state, though, so maybe this is why it shows higher concurrent clocks than possible (especially with no intermediate being C1E available).
 
The invalid effective clock must be some issue in CPU counters due to the configuration. I don't think this is a bug in HWiNFO.
As for the multiple cores @ x60, this is because active core clocks are read serially, one after one. So if the clock boosts during the read cycle it might appear in current value as actual but in fact it isn't due to the way how multitasking systems work and active clock is being read. That's also another reason why you should rather rely on the effective clock.
 
I thought polling is done on all cores at once using one thread per core. If it's done in series then I obviously misinterpreted that part.

An issue of CPU counters just because of disabling all C states (except C6) and E cores seems rather unlikely, does it not?! I will check this again and report back.
 
Polling all cores at the same time would slightly load them all so that might prevent reaching higher Multi-Core Turbo limits.
 
Hi, I'm not sure if this is related, but I've got a 5800X aas well as Hyper-V + Core Isolation enabled, and I believe HWinfo's Thread Usage % stat is bugged.
Clock speed seems ok as it reports 4.0-4.8GHz on each core through a Cyberpunk2077 benchmark, but Core Usage keeps between 1.5-2.5%. The absolute first thread (Core 0 T0 Usage) however, reports much higher (correctly?), at above 65%.
You need to watch the Core Utility values.
 
i9-10900K with Virtualization disabled in BIOS (which does not allow core isolation settings to be accessed in Windows). Hyper-V and Virtual Machine Platform also not enabled in Windows, as you might imagine.

cpu speed.png

Any suggestions?

I won't be moving off 10th gen any time soon, because of some of the 4K video features they disabled in the newer chips.

hwinfo log attached.
 

Attachments

  • hwinfo_log.zip
    2 KB · Views: 1
In comparison to what - Task Manager? I wouldn't consider the clock reported in Task Manager a reliable source. It shows a single clock for all cores/threads. So what does that represent? The minimum/maximum/average value, which kind of clock and does that also include some other factors? No one knows what/how does Task Manager come to the single number... That's like saying "it's warm outside"...
 
In comparison to what - Task Manager? I wouldn't consider the clock reported in Task Manager a reliable source. It shows a single clock for all cores/threads. So what does that represent? The minimum/maximum/average value, which kind of clock and does that also include some other factors? No one knows what/how does Task Manager come to the single number... That's like saying "it's warm outside"...
To your question of "comparison to what?", it's really to HWiNFO running on Win10...
On Win10 I used HWiNFO with an i7-10700K and frequently saw clock speed up to the max Turbo speed.

The attached log file captures me running Cinebench, User Benchmark, and a few minutes of Battlefield 2042 with my i9-10900K (3.7 base clock with max Turbo boost of 5.3). You will see that at no time does it go beyond 4.8 even though temps and power are fine. This seems odd.

I imagine there is something I am misunderstanding. You know a lot more about the readings than I do.
 

Attachments

  • hwinfo_log.zip
    27.5 KB · Views: 2
If all cores are heavily loaded then the clock is reduced due to Multi-Core Turbo limits, according to actual limits per number of cores utilized.
 
If all cores are heavily loaded then the clock is reduced due to Multi-Core Turbo limits, according to actual limits per number of cores utilized.
I think I understand what you're getting at. However, this doesn't explain why I often saw max speed (on a couple cores) on Win10 and not on Win11 (running numerous different types of workloads).

Obviously, Turbo Boost is turned on in BIOS.

I realize it's not your job to educate people on Turbo Boost. I'm bringing it up, because of the differences I'm seeing in Win10 and Win11.

Thanks for helping those of us who don't know as much about this as you do.
 
Not sure why exactly you observe such difference, it would have to be examined in detail - what are the actual Turbo limits, how much is each core loaded, etc. Anyway, the scheduler in Windows 11 should be different form Windows 10.
 
Not sure why exactly you observe such difference, it would have to be examined in detail - what are the actual Turbo limits, how much is each core loaded, etc. Anyway, the scheduler in Windows 11 should be different form Windows 10.
"Not sure why exactly you observe such difference" - because it's something multiple people have noticed and appears to be a difference in the apps' functionality in Win10 vs Win11.

Also, I'm not sure what scheduler you are referring to.

Nonetheless, based on your responses, I'm going to move on and not lose any sleep over it.
 
Although I'm moving on, I did notice something after doing a fresh Windows 11 install that may be of interest...
HWiNFO showed the clock speeds I would expect - i.e. bouncing between 800 MHz and 5.1 GHz.

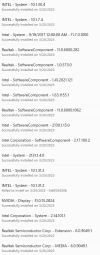
Once I ran "Check for updates" for the first time, Windows automatically installed the following.

Screenshot 2023-03-20 132909.png
One of those, unfortunately, caused the clocks to go back to the same strange numbers I was seeing before - i.e. all under 1.2 GHz.
 
Last edited:
Hey there. Its my first post here. I'm glad i found this post because I'm encountering the same issue.

HwInfo on my Asrock Z590 Pro4 and i7 10700k reporting different clock speeds. From 100mhz - 1.2ghz.

I was getting 1.2ghz Max on all 8 cores on my 10700k until I disabled Memory Integrity and Local Security Authority Protection under Core isolation.

I was also getting normal readings between 4.7ghz - 5.1ghz with a clean install of Windows 11 22H2. However the issues popped up as soon as I updated to the Insider Preview builds. I guess it keeps getting fixed and broken again.. Right now I'm leaving Core Isolation off but I would actually like to turn it on for the better security.

I can confirm Windows 10 did not have this issue. It's certainly a Windows 11 problem and the only ones who do get this issue will be the ones who own a 8th - 10th gen CPU.
Are you saying as long as you have Memory Integrity and LSA off, it works, or is it broken again with latest update(s)?

BTW - I kept Windows Insider off to see what would happen. Unfortunately, that didn't help, as I describe above.
 
Are you saying as long as you have Memory Integrity and LSA off, it works, or is it broken again with latest update(s)?

BTW - I kept Windows Insider off to see what would happen. Unfortunately, that didn't help, as I describe above.
Correct. I was on Windows 11 Stable build and it was still working with Memory Integrity and LSA enabled. I enrolled into Windows Insider Preview build and I noticed it stopped giving correct readings over the weekend. I've tested CoreTemp and HWMonitor readings, they seem to be affected too.

I had to turn off Memory Integrity and LSA to get it to work after digging through Google. Didn't know such an issue existed prior to updating to Windows 11, or I wouldn't have updated. I'm too far into the Dev Build cycle to roll back my machine, so I just kept Core Isolation options turned off. As long as those 2 options are turned off, HwInfo works as expected.
 
Back
Top