Hello everyone
I am a new user to HWInfo and i like it so far very much. Good job!
But i have one little problem when i want to use the Excel log file to create a chart.
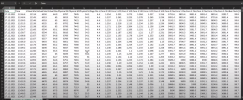
In the tutorial i was watching, the Excel file was well "sorted" in rows and columns, so it was easy to create a nice chart out of it.
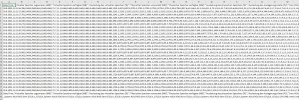
In my case, all the parameter names and logged data are shown in the same row and in the same column.
Did i do something wrong or have i forgot to change something in the settings of HWInfo?
Does anyone had this problem too and could solve it?
I have attached two pictures, one is a screenshot from the tutorial file and one of my Excel file.
Thx for everyone that can help me!
PS: I know that there is LogViewer, but I dont like the style really much. I prefer excel charts


