desgen
Use monitoring tools like
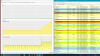
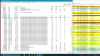
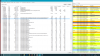
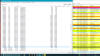
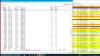
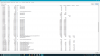
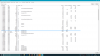
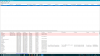
Process Hacker and see process properties (go to Process tab and press Enter in to process string) Performance tab, Memory graph and check Memory tab for find whats modules used too much memory and write bug-report to AMD - this is error in to here software, which I have not been surprised for so many blunders in the drivers of ATI/AMD are present since the release of first video card ATI Mach8 and often do not correct for decades.
ATI / AMD has always had a good video card circuitry copied from the IBM 8514 / A, but at the same time for desktop boards are traditionally equipped with hastily written drivers with a lot of errors, and well-written and carefully debugged drivers for professional boards that are usually built on the same microchips as their desktop analogs have numerous built-in checks to prevent them from running on "foreign" cards.
ATI / AMD is the only device that uses such an extravagant way to prevent competition between its mass and professional products. All other manufacturers use either specially developed for the professional and mass market segments of the family of chips (for example, 3DLabs GLint - Z-buffer 32 bits, frame buffer and texture memory up to 40 MB VRAM for 3D professional solutions, and 3DLabs Permedia - Z-buffer 16 bits, frame buffer and memory textures up to 8 MB DRAM for AutoCAD and entry-level systems) or use the microarchitecture chipset (NVIDIA GeForce / QUADRO / Tesla) programmable by a set of control signals.