Hi there,
long time HWiNFO user here, but first time to post in the forum (obviously). Before reporting this as a bug I want to investigate further to check if I'm doing something wrong or missed anything.
Here goes. I wanted to use HWiNFO64 to monitor sensors on a server, but as long as this issue is there, I can't and won't. The issue: As soon as I start HWiNFO64 the Core #0 and Core #1 VID don't come down after HWiNFO is done initializing its stuff which is causing higher power draw and temperatures. If I restart CPU-Z while HWiNFO64 is running the Core #0/#1 VIDs come down again - until I restart HWiNFO64. The VIDs also don't come down when closing HWiNFO64, they stay high until CPU-Z is (re)started. I tried disabling as many sensor types as possible (see INI values below) to see if that changes anything - it doesn't.
Important notes:
Screenshots of CPU-Z and HWiNFO64.
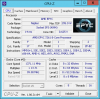
CPU-Z before starting HWiNFO64
[attachment=3044]
CPU-Z after starting HWiNFO64
[attachment=3045]
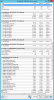
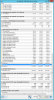
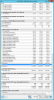
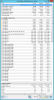
HWiNFO64 before restarting CPU-Z
[attachment=3046][attachment=3047][attachment=3048]
Here you can see that Core #0/#1 VIDs are higher than all other Core VIDs.
Will post the remaining three screenshots in a following post.
Why is the Core VID not coming down when the system is idle, until I (re)start CPU-Z? Am I missing something?
Regards
Dalai
long time HWiNFO user here, but first time to post in the forum (obviously). Before reporting this as a bug I want to investigate further to check if I'm doing something wrong or missed anything.
Here goes. I wanted to use HWiNFO64 to monitor sensors on a server, but as long as this issue is there, I can't and won't. The issue: As soon as I start HWiNFO64 the Core #0 and Core #1 VID don't come down after HWiNFO is done initializing its stuff which is causing higher power draw and temperatures. If I restart CPU-Z while HWiNFO64 is running the Core #0/#1 VIDs come down again - until I restart HWiNFO64. The VIDs also don't come down when closing HWiNFO64, they stay high until CPU-Z is (re)started. I tried disabling as many sensor types as possible (see INI values below) to see if that changes anything - it doesn't.
Important notes:
- The system is idle in any case
- All ways to read the voltages (CPU-Z, HWiNFO64, IPMI) report (almost) the same values. So, it's not that one program reports something completely different than another program
- If you require more information please do not hesitate to ask
- SuperMicro AS-2013S-C0R
- AMD EPYC 7261
- Windows Server 2012 R2 (Nov. 2014), freshly installed, without any updates so far (shouldn't matter for this issue)
- All drivers installed
Code:
SWSMI=0
SMBus=0
AC97CodecID=0
GPUI2C=0
PCIdirect=0
UseHPET=0
AutoUpdate=0
GPUI2CNVAPI=0
BusClkPolling=0
SummaryOnly=1
WakeGPUs=0
iMEsupport=0
GPUI2Ccaching=0
DecimalSeparator=.
ThousandsSeparator=,
CsvSeparator=,
MinimizeGraphs=1
TextButtons=0
SensorRowShading=1
SensorsTopmost=0
CSMI_SAS_Support=1
DebugDirect=0
GPUI2Cforce=0
MinimalizeSensorsClose=0
KeepTheme=0
WakeGPUsExt=0
PollSleepingGPUs=0
ShowWelcomeAndProgress=1
EnablePchTherm=0
ReorderGPUs=0
NvmlSupport=0
PreferAMDADL=0
SMART=1
ATAStats=1
SupportCorsairAsetek=0
SensorInterval=5000
SmartScanRate=1
EcScanRate=1
Screenshots of CPU-Z and HWiNFO64.
CPU-Z before starting HWiNFO64
[attachment=3044]
CPU-Z after starting HWiNFO64
[attachment=3045]
HWiNFO64 before restarting CPU-Z
[attachment=3046][attachment=3047][attachment=3048]
Here you can see that Core #0/#1 VIDs are higher than all other Core VIDs.
Will post the remaining three screenshots in a following post.
Why is the Core VID not coming down when the system is idle, until I (re)start CPU-Z? Am I missing something?
Regards
Dalai


")