Hello,
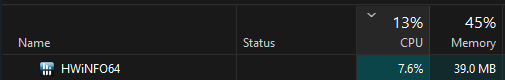
I'm using the latest beta build and I noticed really high CPU usage while the program is minimized to tray. At times I've seen it climb as high as 18% and I have no idea if it's related, but at the same time as it goes into the double digits, my CPU temperature spikes to 79-85C. When the CPU usage drops my temperature goes back to normal as well. I'm using the program at default settings, with the only 2 options enabled being report to gadget, because of Fan Control and an alert set to inform me if my GPU pin voltage ever drops below 11.8V (RTX4000s series GPU). I've enabled profiling time, to see if anything is out of the ordinary there, but the highest delay I've seen is 90ms on a sensor I disabled. I really have no idea what's going on and it seems to happen at random times, regardless if under load or idle.
My system is:
Motherboard: Asrock B650E Steel Legend WiFi
CPU: Ryzen 7900X3D / Curve Optimizer -25 / Limited to 85w and 85C
RAM: G.Skill Trident Z Neo 2x32GB 6000Mhz CL30 Expo on
GPU: MSI RTX4080 Suprim X on latest driver
BIOS: Latest version
OS: Windows 11 Pro Build 22621.3007