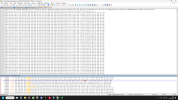
Potential reason, graphical device being reset... Actual reason, no clue. Why CPU readings are ones that were affected - no idea. Why readings hadn't recovered, no idea. How to reproduce, no idea.
I already had long time issue of HWINFO randomly reading 0.000 V, 0 mHz and 0 degrees temps on per-core readings.
Now, different CPU and even different motherboard. 5800X3D, X570S AORUS ELITE AX, RX 6750XT.
What happened today, though, is something else. Max readings were completely out of whack, and current readings are permanently stuck at 0. So much that HWINFO decided to disable reading most of the values after some time.
And values that are recorded as max (and current L3 cache reading), are, like, 33 digit numbers of mHz! Voltage, tdie temp and PPT report themselves correct though. Basically only everything that counts stuff on per-core basis breaks.
Values of 0 at Average colum means that this stuff lasts for 2 hours or more.
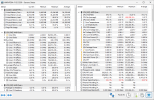
And to prove it that it is not CPU that reads out wrong, here is monitoring of CPU data adjacent to HWINFO. No, secondary monitoring is not being ran for last 2 hours. It is just here to proof that CPU gives out proper readings without hitch.
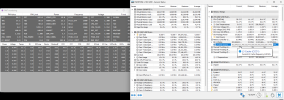
UPD: Restarting HWINFO didn't help... It still cannot see CPU readings properly, while RTSS and other tools can. Here is debug file in .zip archive. 1 minute of bugged runtime when sensors were lacking.
If i run HWINFO from different .exe in different directory, everything seems to be fine.
Looks like after running secondary .exe, when i ran HWINFO from primary .exe it managed to detect everything properly again.
I already had long time issue of HWINFO randomly reading 0.000 V, 0 mHz and 0 degrees temps on per-core readings.
Now, different CPU and even different motherboard. 5800X3D, X570S AORUS ELITE AX, RX 6750XT.
What happened today, though, is something else. Max readings were completely out of whack, and current readings are permanently stuck at 0. So much that HWINFO decided to disable reading most of the values after some time.
And values that are recorded as max (and current L3 cache reading), are, like, 33 digit numbers of mHz! Voltage, tdie temp and PPT report themselves correct though. Basically only everything that counts stuff on per-core basis breaks.
Values of 0 at Average colum means that this stuff lasts for 2 hours or more.

And to prove it that it is not CPU that reads out wrong, here is monitoring of CPU data adjacent to HWINFO. No, secondary monitoring is not being ran for last 2 hours. It is just here to proof that CPU gives out proper readings without hitch.

UPD: Restarting HWINFO didn't help... It still cannot see CPU readings properly, while RTSS and other tools can. Here is debug file in .zip archive. 1 minute of bugged runtime when sensors were lacking.
If i run HWINFO from different .exe in different directory, everything seems to be fine.
Looks like after running secondary .exe, when i ran HWINFO from primary .exe it managed to detect everything properly again.
Attachments
Last edited:

