leoholanda
New Member
Hi guys! I have used HWInfo for several years and only recently realized how logging is a very interesting feature that makes our lives a lot easier when it comes to understanding the behavior of the computer over time, especially with different usage loads. Initially, I tried to interpret the log data in the spreadsheets, which was not very intuitive. I looked for some alternatives, including here on the forum, but I needed something more specific. It was with this in mind that I created LogCharts.

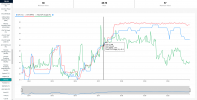
With it, it is possible to generate a line chart representing any data present in the log. You can view smaller parts of the graph with the "brushing" functionality, check the individual values through the tooltip and check the minimum, average and maximum values of the selected data. You can also add more than one line to the chart, allowing you to compare different data over time. I thought it would be interesting to just access a link in the browser, load the log and then have access to the chart to be able to interpret it, making the process simpler and more intuitive.
With LogCharts, I was able to analyze a strange voltage problem in the Ryzen 3200G that I use. With the VCore in the BIOS set to Auto, the voltage reached worrying peaks, as well as the CPU temperature. After researching, I changed the VCore to Normal and I could see that the VCore line on the graph was much more stable. I deactivated Core Boost so the temperatures are now also at a more acceptable level.
I am an Information Systems student in the third year and I have no professional experience with webdev, so I am still learning a lot. LogCharts has no backend or database, which helps to decrease the complexity of the code. So, I thought it could be a great project to solve the problem of interpreting the logs in an intuitive way, perhaps not only for me but for other people as well, in addition to helping me learn more about webdev and compose my portfolio in search of internships.
If (or should I say "when"?) a bug appears, please let me know and I will do my best to try to fix it. I needed the help of the translator because English is not my native language so forgive me if something in the text looks strange. I hope LogCharts can help you identify problems and find solutions more easily, as well as better understand how your computer behaves over time!
Here is the link to the repository on GitHub: https://logcharts-io.pages.dev/
And here is the link where you can access LogCharts: https://logcharts-io.pages.dev/
Last edited:
