Unknown Zombie
Member
I can't reproduce it at will, it just eventually happens if the program runs long enough. Any time I've had it happen I simply had HWinfo running in the background while I played a game.Can you easily reproduce the erroneous temperature reporting, or is it only under certain conditions it appears?
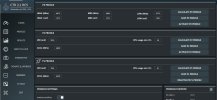
You can see from the screenshot I shared that HWinfo had been open almost 4 hours when I took the screenshot. I don't know at what point in that time period the issue occured.
I'll have HWinfo record a log file while I play a game for a while and, if the issue occurs, I'll upload the log here in hopes that it helps.