Possible BCLK overclocking clock readout bug

DanRaj

Member
Running 5800X3D CPU and latest stable 7.42-5030 build on Win 10.

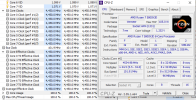
The CPU has 44.5x multiplier for all core loads and 45.5x for single core boost. When OCing the BCLK to 101.9375 MHz, HWInfo will presumably report FCLK, UCLK and boost clocks incorrectly while it's showing BCLK running at 101.9 MHz.
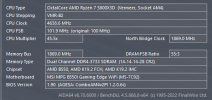
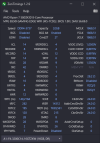
CPUz, AIDA64 and ZenTimings will correctly report Core Frequency, FCLK and UCLK: 4638 MHz core, 1868.5 MHz MCLK/FCLK/UCLK.

However, HWInfo will only report the 44.5x multiplier (effectively 4536 MHz), the CPU never goes to 45.5x according to the sensors. I have confirmed the CPU performs better in single core loads, so it does boost higher than before.

I have seen other people running HWInfo and it correctly reporting 4600+MHz boost, but I don't know if there's any setting affecting it. HWInfo screenshot is after running a light singlethread load that should boost to 4600+MHz
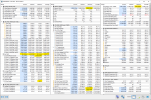
Screenshot 2023-04-02 001142.pngScreenshot 2023-04-02 000731.pngZenTimings_Screenshot_28006445.7404289.png
 
FCLK and UCLK will be fixed in the next HWiNFO Beta build.
As for the other core clocks, are you perhaps using the "Snapshot CPU Polling" mode in HWiNFO? If yes, try to disable it.
 
Thanks for the quick reply.

Yes, disabling Snapshot CPU polling fixes the core clocks readout. Looking forward to newer builds, will report if the UCLK/FCLK is fixed.
 
Interesting. That means the CPU/SMU doesn't know at which BCLK it is actually running :D
Are the effective clocks also correct with disabled "Snapshot CPU Polling" mode?
I will need the HWiNFO Debug File to check some details and see how to fix the core clocks too.
 
Last edited:
Are the effective clocks also correct with disabled "Snapshot CPU Polling" mode?
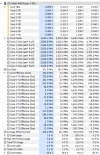
Yes, but only Core 0 effective clocks seems to deviate from the group. However, it could be it's just clock stretching as I haven't finalized OCing yet. Screenshot from a couple of passes of single core loads, captured with 500 ms update interval.
Screenshot 2023-04-02 093859.png
Debug file is created with Snapshot polling disabled, if that's ok?
I'm running AGESA 1206c as I've found it gives better performance/temps than newer ones.
 

Attachments

Thanks. I will also adjust the core clocks for this case to properly reflect the BCLK.
 
FCLK, UCLK - fixed
All core load clocks - fixed
Single core loads - not fixed. The report doesn't show it going above 4536 MHz where it should be 4638 MHz.
 
Hmm, type of load should not matter as the clock read method is same. So this is most likely something related to the observer effect.
Same behavior with "Snapshot CPU Polling" mode on and off?
 
Ok, seems to be working as it should in single core loads too. Not sure if I needed to run the testing app for longer, but now it shows 4600+ in Snapshot polling too.

EDIT: the reason for single core loads not showing up correctly in my previous post with the beta is that I forgot I had an app in the background that prevented cores from going to C6 state, which prevents it from boosting to 45.5x multiplier.

Thanks for the quick fix.
 
Last edited:
Just to add a bit more nitpicking: despite core clocks showing 4600+MHz, Core ratios doesn't show 45.5x but ~44.5x, L3 Clocks aren't the same 4600+ as core clocks and the Frequency limit - global doesn't allighn with effective core clocks (stays around the 4536 MHz mark).
 
Well, "Frequency Limit" is an internal limit imposed by CPU that might be based on default 100 MHz BCLK. Since we don't know how exactly this limit works, whether it's rather a limit for the current ratio than the resulting clock based on BCLK, I'm not sure whether it would be correct to scale this per actual BCLK too.
 
Well, "Frequency Limit" is an internal limit imposed by CPU that might be based on default 100 MHz BCLK. Since we don't know how exactly this limit works, whether it's rather a limit for the current ratio than the resulting clock based on BCLK, I'm not sure whether it would be correct to scale this per actual BCLK too.
Thanks for the info, makes sense.
 
Back
Top