scan interval and hot key for logging start and end

Toorop

Member
Hi,

How to interpret the Time values that are saved in the log file?

My first problem is that it doesn't match the desired scan interval. If I set the scan interval to 200ms I got values around ~0.31 sec apart. If I set it to 750 ms I got values around 0.86 sec apart.
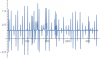
Moreover, I got some big spikes in the pacing of the sensor reads. Strangely, this can make the read intervals not strictly increasing - check the sensor data and picture attached. There's some sort of data buffering and this causes the hick-ups?

My other issue is that I can get the app to start (and stop) logging when I hit the hot key (HWiNFO64 Sensor Settings / Automatic logging).

I reproduced the issues on 2 different computers - attaching only one report, debug file.

Thanks!
 

Attachments

  • HWiNFO64.DBG
    872.7 KB · Views: 2
  • AEOLUS.HTM
    168.7 KB · Views: 1
  • scan_interval.png
    scan_interval.png
    10.1 KB · Views: 1
  • sensor_data.CSV
    260.8 KB · Views: 2
I'm not sure what the attached graph exactly shows, so it's hard to make a statement.
But I suspect the delay in sampling frequency might be caused by some sensor which takes longer to read out (or might cost more resources). Try to disable some sensors and see if you can see a difference - I suggest to start with the SMART sensor or GPU CHL8214.

As for the hotkey, try to define a different one - you might use some that's reserved by the system.
 
The graph show the time difference between each subsequent sample. Let me explain in detail.
The log file contains:
Date - Time - Sensor Data 0 - Sensor Data 1 - ...
18.4.2016 - 10:10:34.335 - ...
18.4.2016 - 10:10:34.609 - ...
18.4.2016 - 10:10:34.885 - ...
18.4.2016 - 10:10:35.159 - ...
18.4.2016 - 10:10:35.434 - ...
18.4.2016 - 10:10:35.708 - ...
18.4.2016 - 10:10:35.983 - ...
18.4.2016 - 10:10:36.257 - ...
18.4.2016 - 10:10:36.531 - ...
18.4.2016 - 10:10:36.808 - ...
18.4.2016 - 10:10:37.82 - ...
18.4.2016 - 10:10:37.357 - ...
18.4.2016 - 10:10:37.631 - ...

I disabled everything but for the CPU utilization / core.

If you subtract a Time reading from it's predecessor (the one above it) you get the sampling intervals (I set 250 ms):
0.274, 0.276, 0.274, 0.275, 0.274, 0.275, 0.274, 0.274, 0.277, 1.012, -0.463, 0.274

As you can see, there is some sort of error at the end. There's a huge delay in one reading (1 sec) and the next one indicates that it did happen sooner (negative value). This is what I call a spike.
To eliminate the negative values one can reorder the readings according to their Time values so they follow each other in a strictly increasing fashion in time. Unfortunately, the spikes remains, so this is not some sort of buffering problem.

These things happen in a regular interval (as my graph shows). I am just curious about the reason behind this.

Unfortunately, no hotkey combination works on my PC, none.
 
I think there's some math problem ;)
If you look at the last values, the 10:10:37.82 means .. 37 seconds and 82 milliseconds (not 38.820 seconds). Then those numbers give correct results.
So if someone parses "37.82" as a whole number then it doesn't give a correct result, but if it's parsed as two separate numbers then it's OK.
I will update HWiNFO to show "37.082" instead.
 
Upps, how the hell I was not able to figure this out. And of course, this explains the regular spikes.  :rolleyes: :cool: 

Thanks!
 
Back
Top