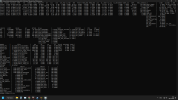
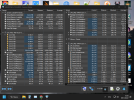
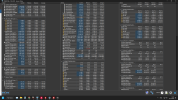
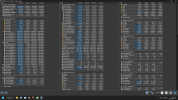
Strange readouts after unfolding minimized window of HWInfo

What do you mean with "2 deep CPU monitoring tool"? Are you running multiple monitoring tools alongside? If yes, the problem could be due to a conflict between them.
Nah, i only use them in sessions (they are too taxing, as their reporting speed about 10-20 refreshes per second). And when i use them i don't care much about HWINFO readings, as they are used for instantenous values. (And they really mess up HWINFO in terms of max clock readings. I saw up to 56.5 gHz on max frequency few times, and i know it is not true)
HWINFO on other hand misreports 0 mHz clocks consistently and randomly even without them being enabled.
Only things that can potentially affect HWINFO are MSI Afterburner and AMD Adrenaline software? And i kind of sorted out that installing Adrenaline without RyzenMaster component won't affect HWINFO.
And MSI Afterburner had no effect on HWINFO at least up to some point.
Hmm... I will try to check CPU monitoring off from Afterburner (I use it for overlay data)
 
UPD: Nope... Even without Afterburner and CPU monitoring in Adrenaline HWINFO still randomly reports 0.00 mHz. But only on effective clocks?
Can they actually be less than 0.1 mHz?
 
What is the Ring 0 monitoring tool you're referring to in previous post?
ZenPT Monitor, it is CPU focused tool. And specific to Zen based AMD CPU's
Granted some lines may be not named correctly, but most of them show what they must
Here is how it looks. Simple, but practical
1670568862412.png
 
Run without it, I'm pretty sure the problem is a collision between that tool and HWiNFO.
 
Run without it, I'm pretty sure the problem is a collision between that tool and HWiNFO.
I mean, of course i use HWINFO without it, as i said i don't run this tool constantly, it is taxing.
It actually takes processing power from Core 0 and reporting speed can get slower if there is high load on this core.

More than that. I also don't use this tool constantly explicitly because it uses Ring 0 access. Anticheats don't like running it at background whatsoever
 
1670570291607.png

No GPU drivers = No Adrenaline
No Afterburner
No Fan Control killed it via Task manager
Only HWINFO, basically.
And in first 5 minutes 3 cores reported 0.0 mHz effective clock and 0.0% utilisation.
I am not sure, maybe it is intended? but hard to believe that core 0 will ever have 0.0% utilisation on Windows.

At least there are no bugs with nominal clock, voltage and temperature as it was when topic was just started.
 
For Effective clocks this might be possible if they are gated.
Hmm... Ok. It is just strange that even under load even 0 1 and 2 cores (Windows main, and top 1/2 performance) can get in gated state. But if it is possible. Wonder why i hadn't seen such thing via deep monitoring. Maybe because of additional real-time load?
 
HWiNFO is especially optimized for lowest load and especially with the "Snapshot CPU Polling" option.
I have no insight into how effectively ZenPT is written.
 
HWiNFO is especially optimized for lowest load and especially with the "Snapshot CPU Polling" option.
I have no insight into how effectively ZenPT is written.
Maybe you're right then. ZenPT uses about 50 ms polling rate, so it definitely gives additional load.
Anyways thanks for insight. Will take this into account.
 
At least there are no bugs with nominal clock, voltage and temperature as it was when topic was just started.

Spoke too soon. . .
1670852675932.png

I have 2000 ms polling rate
Hmm... let me see result without snapshot polling for a chance
And it seems like only per-core polls are being messed up.

1670809361966.png

Without snapshot polling per-core VID is broken (it doesn't report correct values whatsoever). Temperature is also broken and can randomly drop to 0
Base core clocks go down to 2940 instead of 0 though, and i am not sure what it means. Base clock for 5600X is 3675, not 2940
 
Last edited:
Back
Top