You are using an out of date browser. It may not display this or other websites correctly.
You should upgrade or use an alternative browser.
You should upgrade or use an alternative browser.
Unreally big powers and 0 RPM fans
- Thread starter Geek_Geekson
- Start date
Martin said:The OPT fan seems to be spinning very slow (max 119 RPM), can you verify using other tools or GIGABYTE SIV what values does it show?
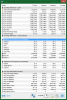
I went ahead and ran HWMonitor 1.40 and it's reporting reasonable RPM values for the fans it's showing.
[attachment=3392]
It just so happens "CPU OPT" is a 3-pin persistent LED fan atop the chassis, and the LED display never scrambles on it, which is to say, the RPMs of the fan can be considered reasonably consistent, or else the persistent display would not be coherent. So, I can also verify the fan is properly spinning with a simple visual inspection.
Exiting and reopening HWiNFO64 restores the fan RPM numbers to agreement between HWMonitor and HWiNFO64.
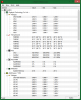
I have put the computer to sleep for a few minutes, and after waking, both programs are still reporting consistent and reasonable fan speeds, however HWiNFO64 is no longer labeling "CPU OPT" as such, but rather as "System 2"
[attachment=3393]
I've gone ahead and set an alert for the fan to see if I can observe any sort of correlating activity in the system when the 0 readings occur and will post further if I observe any behavior that might be going on when this happens.
Attachments

Not sure if it's related, but I just looked at the fan connections on the motherboard and CPU OPT is not even connected to anything. The fan in question is connected to the SYS_FAN2 header.
Is it possible that upon initial startup, HWiNFO64 is misidentifying the fan, then later for some reason correctly identifying and reporting 0 because CPU OPT is not connected?
Is it possible that upon initial startup, HWiNFO64 is misidentifying the fan, then later for some reason correctly identifying and reporting 0 because CPU OPT is not connected?

Indeed, this looks like a fan misidentification and occasional failures of speed readout.
Is this happening always after cold boot? What needs to be done to get the correct fans read - a sleep or perhaps something else too?
Can you check other values like voltages (which you have hidden) if they perhaps show similar behavior?
Also attaching the HWiNFO Debug File might be useful for a more detailed analysis.
So, put the machine to sleep for several hours, and now after waking the system, it appears HWMonitor has likely run into whatever is tripping up HWiNFO64. A new sensor has appeared labeled FANIN1, and it's readings are strangely similar to the CPU OPT sensor in HWiNFO64. The behavior is slightly different though in that it added the low ball sensor, rather than swapping it, as HWiNFO64 does, so rather than losing the correct sensor reading, it's got a disconnected fan header showing up.
[attachment=3397]
[attachment=3398]
I haven't actually cold booted the machine in a couple of months, so I can't honestly answer your cold boot question, but if you think it would help I can perform a cold boot?
I assume this is the debug file you're talking about:
[attachment=3399]
I also created a Report from the main HWiNFO64 window, if that's useful to you, but for whatever reason the forum here won't let me add the attachment either as .LOG or .HTM. Let me know if you want me to send the report via some other method.
All I have to do to get correct sensor readings is exit HWiNFO64 and restart it, same as with HWMonitor.
I really can't help thinking that there is something wrong, like a momentary hiccup, with the way sensors are being reported by this Gigabyte Motherboard (GA-AX370-GAMING K3) and HWiNFO64 just isn't handling it gracefully, if that makes sense.
Attachments

Well, this is really strange and could mean there's some glitch in readout of those values.
I think that HWMonitor reads invalid values as well, it just handles such cases differently and it doesn't show them in such case. HWiNFO on the other hand shows 0 RPM in case an erratic (out of range) value is read.
I'd definitely suggest to completely shut down the machine and start again to see if there will be any difference.
Geek_Geekson
Member
Martin said:HWiNFO on the other hand shows 0 RPM in case an erratic (out of range) value is read.
In case of "out of range" value readed on some iteration, I think that the best solution will be giving "NaN" value and exclude these values from min/max monitoring, instead of giving "0 RPM".
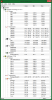
So, after the system has been restarted, the behavior seems mostly the same. Still getting zero minimums for all and a 20k+ RPM max on System 3, but it takes time before those readings occur. And again, a simple restarting of the software returns all values to normal. As for any sort of system behavior that might correlate, I haven't identified any yet. It happens after some random number of hours from starting HWiNFO, the same with HWMonitor.
As for swapping the CPU OPT fan header reading in place of the System 2, that hasn't happened yet, but from the looks of things, given enough time I suspect it will happen again.
Letting HWMonitor run just as long, it had interesting behavior. For whatever reason, despite only 3 of the 5 fan headers on the motherboard being in use, at some point, all 5 were detected as connected and having some measurable RPMs by HWMonitor. Again, I think both piece of software are seeing the values, just reacting differently in how they handle them.
[attachment=3407]
So, Gigabyte advertises smart fan control for all of the fan headers on their current motherboards, including this one, whether you run 3-pin voltage control or 4-pin PWM control fans, and I wonder if there is something peculiar to their fan control, detection, or monitoring that could be contributing to this behavior? I do believe I can manually select the control type in BIOS, so I will see if manual specification has a correlating affect on behavior and report back.
Attachments

Such behavior usually happens when there's a conflict between multiple monitoring tools, which don't play nice together.
HWiNFO and HWMonitor should not be the case, they synchronize together so such issues should not happen.
Can you check if there's perhaps some other monitoring tool running?
HWiNFO and HWMonitor should not be the case, they synchronize together so such issues should not happen.
Can you check if there's perhaps some other monitoring tool running?
Geek_Geekson said:Martin said:HWiNFO on the other hand shows 0 RPM in case an erratic (out of range) value is read.
In case of "out of range" value readed on some iteration, I think that the best solution will be giving "NaN" value and exclude these values from min/max monitoring, instead of giving "0 RPM".
As an end user, how do we know if it's an out of range value or an actual zero value? The same goes for the obviously high value of 20k+ for my System 3 fan. I would think it should be a valid RPM value to the monitoring software, unless there is a defined threshold for max and min.
If out of range values were excluded from min / max monitoring, perhaps another, optional column could be added for sensor out of range errors. As valid ranges may not always be obvious to a software algorithm, perhaps there would need be user configurable valid min / max values set for monitored items.
Martin said:Such behavior usually happens when there's a conflict between multiple monitoring tools, which don't play nice together.
HWiNFO and HWMonitor should not be the case, they synchronize together so such issues should not happen.
Can you check if there's perhaps some other monitoring tool running?
It's definitely not another conflicting tool that I am aware of.
Windows is reasonably fresh, about 6+ month old UEFI install of Windows 8.1, and the only monitoring software that I knowingly run is your HWiNFO64, with HWMonitor as my only backup (not running normally).
Software I may run once in a while such as CPU-Z, GPU-Z, HWMonitor, Thaiphoon Burner, etc. are all stand-alone versions, rather than being based on any sort of installation.
Here's what I have on a regular basis in the System Notification area:
[attachment=3408]
- CSR (apparently consumed into Qualcomm) Harmony Wireless Software Stack (replacement Bluetooth stack for Windows)
- Windows Task Manager (do you want to count this as monitoring software?)
- The older AMD Catalyst Control Center (pre Crimson / Adrenaline versioning [for HD6870]), which has only rudimentary monitoring in it, and nothing about motherboard fans.
- AnyDVD HD
- TaskBar Activate (hides the TaskBar better than the default Windows option)
- HWiNFO64
The only other monitor specific software I'm aware of even having installed to the system is Hard Disk Sentinel, but I'm quite picky about running things unnecessarily, so it only runs during times I specifically want to see it's data. It neither starts with the system nor do I leave it running. I open it maybe once bi-monthly, so I would rule it out unless there are filter drivers always present that might interfere, but can't see why there would be any of those installed for a fan sensor.
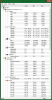
Here's the current Task Manager process list if it helps any:
[attachment=3409]
Here's the current Programs and Features list also, in case anything might catch your eye there:
[attachment=3410]
Attachments

Since the invalid values are unpredictable and also cause appearing of other not connected fans, trying to filter out such values won't be a solution.
I have no idea what could be causing this other than some sort of system/BIOS malfunction. Have you tried to upgrade the BIOS?
We've seen a similar issue after upgrading BIOS but on a different system here: https://www.hwinfo.com/forum/Thread-wrong-data-z390-taichi-4-0
I have no idea what could be causing this other than some sort of system/BIOS malfunction. Have you tried to upgrade the BIOS?
We've seen a similar issue after upgrading BIOS but on a different system here: https://www.hwinfo.com/forum/Thread-wrong-data-z390-taichi-4-0
Tried the latest BIOS released on April 18, 2019. No luck.
Tried specifying fan types in BIOS, PWM or voltage control, rather than leaving it on auto. Again no improvement.
Guess we've hit an impasse unless Gigabyte wants to do something about the issue. I'll hit up their tech support and see what they say.
Thanks for all the suggestions, and I'll try and update if there's any change!
Similar threads
- Replies
- 2
- Views
- 452
- Replies
- 1
- Views
- 93
- Replies
- 14
- Views
- 3K
- Replies
- 1
- Views
- 934