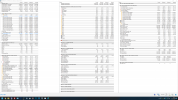
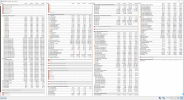
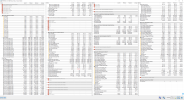
"CPU Core VID (Effective)" vs "Core VIDs"

PiersJH

Well-Known Member
I assume the 'Core VIDs' measures are less accurate? If not, are the data sources from different points? The popup explanation makes sense, but I would expect to see the highest 'VID (Effective)' value match the higher 'Core VIDs' value.

Example:
"CPU Core VID (Effective): 1.55000V"
"Core VIDs: 1.48125V" (highest value shown)
 
I don't think the effective VID has to be the highest one, but those values are also sampled via different methods so it's possible that the different source/sampling time plays some role too.
 
I don't think the effective VID has to be the highest one, but those values are also sampled via different methods so it's possible that the different source/sampling time plays some role too.
Given the variation, which would you say is more accurate and how accurate? Is it a case of Vcore vs VDDCR CPU, with the latter being much more accurate? If so, why include the least accurate measure as default?
 
but those values are also sampled via different methods
Hi!
So are, may I ask, those sampled in a "snapshot mode" just current core psm readings?
 
Last edited by a moderator:
Sorry, I cannot comment further about those values.
I may have possibly found a fix to the issue and thought I'd run it by you given your experience with I2C/SMBus and my understanding of how HWiNFO reads the data. If you don't want to read the wall of text below (it provides context), I've put the main question for you in bold text at the bottom of the post.

Summary
I'll use bullet points to make it shorter.
  • Received new PC
  • Installed Windows 11
  • Installed drivers for devices from motherboard vendor's website
  • Installed AMD Chipset Drivers (message at the end said 'Success' for all components, and the log file showed each driver as 'success')
Testing
With the above, it's a very standard process for any new build or OS reinstall. I then left it for a while until I noticed VID reaching 1.55000V and created this thread.

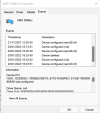
However, the other evening I was looking through Device Manager at the PSP device and noticed that although Windows said the device is working properly, under the item's Events tab, it showed that the device had never started 'Device not started'. I did a test and uninstalled the PSP device, deleted the driver, scanned for new hardware and an unknown security device showed (obviously the PSP device). I manually selected a driver from the unpacked AMD Chipset Driver package (3.10.22.706). The status then changed to 'Device started'.

Since that seemed to work, I thought I'd look at other drivers installed by the AMD Chipset Driver installer. Most of them had the same issue - no yellow warning triangle, a message saying the 'device is working properly', but under Events the most recent log showing 'Device not started'.

AMD I2C Controller driver / GPIO3 / SMBus
The AMD I2C Controller driver had the same issue - alternating 'Device configured' and 'Device not started' messages - these correspond to the dates I installed new chipset drivers.

As mentioned above, no 'yellow warning triangle' was displayed and under 'General', and the device status showed as "This device is working properly"
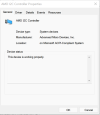
1641494750831.png1641494620440.png

After uninstalling the device -> deleting drivers (if given the option) -> scan for new hardware -> manually select the driver from the driver package, it finally seemed to work, although installed a driver from 2019. Updating the driver using Device Manager did not work, so I repeated the above steps (uninstalled, delete driver, scan, etc.) and Windows automatically selected the latest driver.

1641495175844.png

Here's the two events that should have happened after using the AMD installer.

Code:
--- EVENT [06/01/2022 17:51:23]

Device ACPI\AMDI0010\3 was configured.

Driver Name: oem36.inf
Class Guid: {4d36e97d-e325-11ce-bfc1-08002be10318}
Driver Date: 01/11/2021
Driver Version: 1.2.0.118
Driver Provider: Advanced Micro Devices, Inc.
Driver Section: amdi2c_Device.NT
Driver Rank: 0xFF0001
Matching Device Id: ACPI\AMDI0010
Outranked Drivers: amdi2c.inf:ACPI\AMDI0010:00FF0001
Device Updated: false
Parent Device: ACPI_HAL\PNP0C08\0

--- EVENT [06/01/2022 17:51:23]

Device ACPI\AMDI0010\3 was started.

Driver Name: oem36.inf
Class Guid: {4d36e97d-e325-11ce-bfc1-08002be10318}
Service: amdi2c
Lower Filters:
Upper Filters:

Rather than repeating the above with screenshots, I'll simply state I did the same with each device that the AMD Chipset Driver installer told me it had installed. Even the SMBus, where there is no need for a driver so a 'dummy' is used, had the wrong one - it was a null driver. The correct 'dummy' worked. Here's a screenshot that probably explains it better as I'm tired.
1641495578737.png

The entire purpose of creating this thread is that when correcting the I2C driver issue, I noticed that VID no longer went above 1.50000V. I tried everything I could over a period of three days testing to get it to go to 1.55000V as it did before, but no (at least not so far). On top of that, reported clocks ~5% higher, not that it really matters.

The CPU is still in stock settings, apart from XMP being enabled (currently running an AVX2 workload, hence the lower clocks).

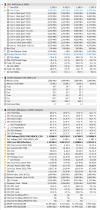
And finally getting to the point, do you believe that a 'faulty' I2C driver could have impacted readings from the Nuvoton super I/O in some way specifically in HWiNFO? All I did was to make sure the devices had the correct drivers and that the Event tab showed the most recent log as 'Device started'.

I've not changed anything else. As mentioned above, I've now tried everything that used to make the VID go to 1.55000V (and VDDCR SVI2 TFN up to 1.55000V as well) over a period of three days and it seems to now be working correctly (VID Effective never goes above 1.50000V). What sort of behaviour would you expect to see with essentially no I2C driver installed?

1641495790598.png
 
Last edited:
@Martin have you had a chance to look at the above post? I'm not asking for any sensitive data, merely your opinion (which I understand is entirely optional) on my theory, given that you have years of highly skilled experience with I2C data.
 
Sorry, I have no idea. This sounds like alchemy and not easy to make any judgements.
 
Sorry, I have no idea. This sounds like alchemy and not easy to make any judgements.
Indeed, which is why I was surprised that it appears to have fixed the issue entirely. Incorrectly installed drivers for the GPIO, SMBus (not that it technically needs a driver), I2C, and PCI (thanks, AMD!) = incorrect/out of specification readings. Correct drivers = correct readings. It entirely depends upon how much HWiNFO uses the Windows driver to take sensor readings, and I suspect the answer to that is 'it takes readings straight from the I2C'

I realise no software is perfect, and HWiNFO can only rely upon what the sensors report. My 10W J5005 is a great example - HWiNFO reports boost speeds of 3600 MHz on all four cores (I've even seen over 4 GHz reported once), yet its maximum all-core clock is 2.7 GHz :p
 
HWiNFO doesn't utilize those drivers, so it's rather just some coincidence.
 
For anyone else in a similar situation. It's now been ~10 days since I appeared to have fixed the issue, and since then I've tried everything I can think of to force it to exceed the limit. The only change I made was to manually install the AMD chipset drivers (the latest available) one by one using Device Manager, and to not install the Power Management driver (which appears to be for Zen 2, but defaults to checked on Zen 3). I'm now seeing the "1.488" that many appear to have listed as the max VID over X time, and a maximum Effective VID of 1.50000V. The configuration below is 'auto' Vcore, XMP enabled, and that's it.

Here's a snapshot of 45 hours of use. In that time, I've run Prime 95 SSE 1C, BoostTester.exe for 1 hour, x265 with only 1T allocated, gamed, and other tasks. Those with the knowledge to understand the relationship between Zen 3 drivers and the hardware see it as either not related or unexplained, but that's the only change that was made. This thread can be closed if needed and I'd like to thank you for helping, Martin.

1641885855845.png

Edit: Current clocks and temps in above screenshot as that way because they've been encoding a queue of files for 28 hours.
 
Sorry to re-open the thread but i've been doing some testing and i don't remember when this happened and at which update or what but MAX core VIDs are not reported correctly anymore to me..they used to reach 1.5V like the effective CPU core VID, but now they are way too low. Even on single thread benchmark..i am using snapshot polling but if i remember well that is not the issue. Chipset drivers are 4.06.10.651 (AMD have released some new ones a couple days ago since).
Also in any of the AMD devices in device manager they have empty event logs..literally blank; all other devices show events.
And another thing i've noticed a few weeks back is that AMD ryzen master got corrupted somehow and needed a re-install for no reason (i had chkdsk /f /r the whole disk and sfc /scannow and didn't find a single issue which is weird)

Here's a screenshot from hwinfo:

1661928689407.png

I'll be uninstalling and re-installing the chipset drivers but this seems really weird


edit: just checked, disabling snapshot polling fixes this:

1661929169873.png
 
Last edited:
Core VIDs are expected to drop down when there's no load. Values too high might be caused by the "observer effect" when polling of a particular core is causing it to run at a higher P-State.
The "Snapshot CPU Polling" mode eliminates this "observer effect" to a minimum and provides and much more realistic (and correct) point of view.
But why if i load a core with a benchmark run like with cpu-z it doesn't read the VID of the core at that point? I don't think the CPU goes to idle for some cycles always at the time when hwinfo is reading the values:/
 
That depends on exact type of workload and polling mode. Check the "CPU Core VID (Effective)" value as this is the value the CPU is requesting.
 
With the method I've posted/linked to, I've not seen reported VID (any of the VID readings), or more importantly Vcore go above 1.50000V. AMD's chipset driver package is fundamentally broken (just look at the current issues with the latest chipset driver package - they can't even create a driver package that installs correctly on a system using a language other than US English(!), which is incompetence at its worst) to the point where it informs users it installed drivers successfully, but the Events tab for I2C (and other devices) show an entirely different story.

I would:
1. Make sure you have the "AMD" directory at the root of your C drive (DON'T delete it) with inf/driver files in it (search the dir for: *.inf
2. Manually uninstall each AMD driver with Device Manager and keep it open.
3. Start installing drivers correctly. You can try I2C as a test (or GPIO etc.) by going to its properties > update driver > point it to the package in the AMD directory named I2C (or something like that - currently on phone not PC). Don't just point it to the AMD directory and hope for the best. That's not worked out well before and Windows will install the wrong driver.
4. Wait for the driver to install.
5. Once it's installed, check the Events tab to make sure it says 'Device Started'. If so, the driver has been installed and is working correctly.
 
Back
Top