Effective clocks not correct on 1st cpu thread, 5800x3d + bclk oc

ssateneth

Well-Known Member
hwinfo pro v7.27-4805

when running a bclk overclock on 5800x3d processor, the 1st thread of the 1st core will always reflect an effective speed relative to a standard 100mhz bclk, even if the bclk is overclocked to somerthing like 107. the 2nd thread of the 1st core, and all other threads will report correctly.

i used cpu-z to check. i assigned affinity to core 0 thread 0 and ran cpu-z, double checking that affinity didnt change. effective clocks are detected as about 4540 and cpuz score of about 665. while the cpuz was running, i changed affinity to core 2 thread 0. hwinfo reflected the load changed to core 2 but a effective clock of about 4880 and the running cpu-z speed score is unchanged, about 665.
 
Try to enable the "Snapshot CPU Polling" option if you'll see different behavior.
 
I just tried that now on -4810. Snapshot CPU Polling causes the ALL instantaneous and effective clocks on ALL cores to reflect as if we're on a 100MHz BCLK, even though my higher BCLK is detected (111.204MHz). Only a single thread per core is visible under "effective clocks" too (8 threads instead of expected 16 threads)

edit: The "Core Ratios" also appear to be much lower than the actual core ratios detected in other programs like Core Temp and CPU-Z
 
Last edited:
With Snapshot Polling the overhead in polling (observer effect) is much lower, so lower clocks/ratios are expected.
I'm wondering whether the initial problem with effective clock on one core isn't due to this:
 
Only a single thread per core is visible under "effective clocks" too (8 threads instead of expected 16 threads)
If you have enabled the tooltip option, when you hover pointer on the Snapshot CPU Polling setting you can read (last note) that some per-thread values might not be visible. I guess this is how it works.

----------------------

edit: The "Core Ratios" also appear to be much lower than the actual core ratios detected in other programs like Core Temp and CPU-Z
Your answer is this:
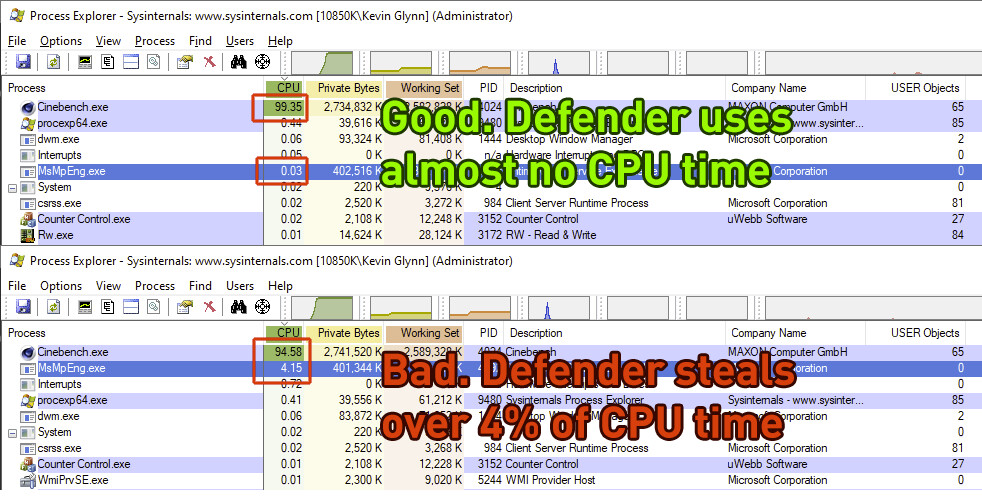
With Snapshot Polling the overhead in polling (observer effect) is much lower, so lower clocks/ratios are expected.
And what it truly means is that all the other software you mention are causing the CPU to work higher (as they load it) in their try to read (poll) the info/value (aka the observer effect) because they dont use the snapshot method. Snapshot method is minimizing the observer effect.

In physics, the observer effect is the disturbance of an observed system by the act of observation.

So what you see in other software is a bit far from the real thing or (better=) the thing that it should have been...
 
Last edited:
With Snapshot Polling the overhead in polling (observer effect) is much lower, so lower clocks/ratios are expected.
I'm wondering whether the initial problem with effective clock on one core isn't due to this:
I use dcontrol to fully disable windows defender. defender isnt running.
 
With Snapshot Polling the overhead in polling (observer effect) is much lower, so lower clocks/ratios are expected.
I'm wondering whether the initial problem with effective clock on one core isn't due to this:
Hello
i have the same problem.. and not just me or this guy..
 
hwinfo pro v7.27-4805

when running a bclk overclock on 5800x3d processor, the 1st thread of the 1st core will always reflect an effective speed relative to a standard 100mhz bclk, even if the bclk is overclocked to somerthing like 107. the 2nd thread of the 1st core, and all other threads will report correctly.

i used cpu-z to check. i assigned affinity to core 0 thread 0 and ran cpu-z, double checking that affinity didnt change. effective clocks are detected as about 4540 and cpuz score of about 665. while the cpuz was running, i changed affinity to core 2 thread 0. hwinfo reflected the load changed to core 2 but a effective clock of about 4880 and the running cpu-z speed score is unchanged, about 665.
Did you manage to understand this ? me and other people i've been reading have the same problem..
 
Back
Top