GPU "Throttle Reason - Current" what is it?

aktD

Member
Hello, I've tried searching everywhere for what this means but can't find anything.

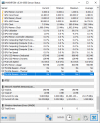
Everything is working fine, no crashes, no unexpected dips in performance, overall the GPU is performing just as expected. However, last night I checked the sensor readings right after about an hour of gaming and I noticed it said "GPU throttle reason - current YES" at the maximum value.

I have no idea what this is, can someone help me?

My PSU is a Super Flower Leadex III gold 750W.
GPU : Radeon 6800. Currently I power it using a daisy-chain single cable. I kept reading about that and I'll switch to using 2 separate cables.

Thank you for your time!
 
Please try the latest Beta version of HWiNFO (v6.35) and then post a screenshot of the values shown.
 
Please try the latest Beta version of HWiNFO (v6.35) and then post a screenshot of the values shown.
Just downloaded 6.35 and now I'll wait for it to see if the value is shown again.

This is a screenshot with the 6.34 version:
 

Attachments

  • HWinfo screenshot 6.34.PNG
    HWinfo screenshot 6.34.PNG
    62.4 KB · Views: 13
That should mean the GPU clock was throttled because it reached the limit on Current (Amps).
But let's wait for results from 6.35 as that should show more details on these GPUs. Does it show the TDC values? A full GPU section screenshot will be useful.
 
That should mean the GPU clock was throttled because it reached the limit on Current (Amps).
But let's wait for results from 6.35 as that should show more details on these GPUs. Does it show the TDC values? A full GPU section screenshot will be useful.
Yes it does seem to show a lot more. I haven't yet changed the pci-e cable. It's still a single daisy-chained cable powering the gpu.

EDIT: The memory clock is constantly almost maxed because I'm using dual monitors. I've read this is common and considered normal.

Here is the new 6.35 screenshot:
 

Attachments

  • HWinfo screenshot 6.35 Full GPU.PNG
    HWinfo screenshot 6.35 Full GPU.PNG
    103.2 KB · Views: 10
My assumption is that it might be hitting the TDC limit.
But I also see that HWiNFO fails to read some parameters (those in gray). Could you please run it in Debug Mode for a while to let the grey items appear, then close it and attach the HWiNFO64.DBG file it produced?
 
My assumption is that it might be hitting the TDC limit.
But I also see that HWiNFO fails to read some parameters (those in gray). Could you please run it in Debug Mode for a while to let the grey items appear, then close it and attach the HWiNFO64.DBG file it produced?
From what I can tell the values appear in grey when the GPU is idle. If I start up anything utilizing the GPU they will all light up.

What exactly does it mean when it reaches its TDC limit? Is it bad? What can be done?
 
Here it is. I started up the most demanding game I have and played it for about 5 minutes. You can see the sensors are all up and reading fine. No Current Throttle just yet, and all the values seem ok to me..
 

Attachments

  • HWinfo screenshot 6.35 Full GPU 15 min under load.PNG
    HWinfo screenshot 6.35 Full GPU 15 min under load.PNG
    121 KB · Views: 9
Yes, none of the limits has been hit yet. Even if that would happen it's pretty normal that in such case the performance would be reduced.
You might want to start some intensive benchmark (i.e. Furmark) to see it reaching a limit.
 
Yes, none of the limits has been hit yet. Even if that would happen it's pretty normal that in such case the performance would be reduced.
You might want to start some intensive benchmark (i.e. Furmark) to see it reaching a limit.
I will but first I want to add the second pci-e cable. I got worried since a guy on reddit got his psu slot fried because he used a single daisy-chained cable like me. Apparently it's good practice to use 2 separate cables. I didn't know this.
 
Yes, none of the limits has been hit yet. Even if that would happen it's pretty normal that in such case the performance would be reduced.
You might want to start some intensive benchmark (i.e. Furmark) to see it reaching a limit.

Here it is after I put 2 pci-e cables. I ran about 3-4 classic benchmark tests at 1440p and then a stress test for ~15 minutes. I waited till the temps seemed to stagnate and let it sit there for about 10 minutes. That throttle is no longer there so I guess everything is fine? It did manage to pull way more Watts than in any game I've played so far..
 

Attachments

  • HWinfo screenshot 6.35 GPU Furmark 15 min.PNG
    HWinfo screenshot 6.35 GPU Furmark 15 min.PNG
    117.8 KB · Views: 9
Yes, looks OK. You also managed to finally hit the Power (PPT) limit, but that's perfectly normal.
I'd still like to look into why some items occasionally cannot be read if you could upload a HWiNFO Debug File.
 
Yes, looks OK. You also managed to finally hit the Power (PPT) limit, but that's perfectly normal.
I'd still like to look into why some items occasionally cannot be read if you could upload a HWiNFO Debug File.

Here's the debug file. I closed HWinfo, opened it again with the debug selected, ran another ~10 min Furmark stress test. Hopefully everything you need is inside. But one problem, the file is ~47MB and I can't seem to be able to upload it here. Is a wetransfer link ok?
 
It happened again and this time I think I figured out why.

After 15 min of afk the monitors enter sleep mode/energy saving whatever it's called. When I returned I checked and sure enough Throttle Reason Current- Yes. So something funky is happening when the monitors enter sleep mode or when they come back online.

EDIT: Sadly I turned off the debugger :(. I'm turning it back on again and trying to replicate.
 

Attachments

  • HWinfo screenshot 6.35 Throttle Current Yes.PNG
    HWinfo screenshot 6.35 Throttle Current Yes.PNG
    103.5 KB · Views: 6
I think you should not worry about this. It might be an issue in the GPU drivers, but nothing serious, only a problem in reporting of the throttling reasons.
 
I think you should not worry about this. It might be an issue in the GPU drivers, but nothing serious, only a problem in reporting of the throttling reasons.
You are most likely right. Tried replicating it and I can't... Will continue monitoring, but most likely nothing serious.
 
Back
Top