HWiNFO64 (Beta and Non-Beta) Clock Speed Reporting

My primary sensor and data readout concern with a new 12900KS build is to monitor my two preferred Performance Cores (#4 and #6). While I understand that HWiNFO is the leader in this space at sensor accuracy and reliability, my concern is in the readout for clock speeds within the sensor UI.

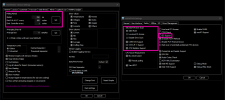
As per the attached screenshot, virtually all other clock speed reporting tools (CPU-Z, HWMonitor, etc.) seem to reflect accurately and rapidly when Cores #4 and #6 Turbo Boost from 5.2 GHz to 5.5 GHz. On the contrary, HWiNFO never seems to report the clock speed increase in real-time, though something appears to be happening on the back-end to reflect the 5.5 peak in the Max column view.

In an attempt to troubleshoot, I've modified the Global Polling Period value in a range from 50ms minimum to upwards of 5000ms and no matter the value, the two preferred 5.5 GHz-capable cores don't change in real-time within HWiNFO.

Anything I can do to get these sensors in line with other clock speed monitoring utilities?
 

Attachments

  • 2022-05-22 17 35 52.png
    2022-05-22 17 35 52.png
    85.1 KB · Views: 25
Last edited:
That might be because the 5.5 GHz spikes are very short. Check the Effective Clock values, do those reflect them ?
 
That might be because the 5.5 GHz spikes are very short. Check the Effective Clock values, do those reflect them ?

Take a look at the two at the attached screen recordings, one recording showing CPU-Z and HWMonitor alongside HWiNFO in the middle and the other recording showing the effective clocks in HWiNFO.

As you'll see, the peaks of up to 5.5 GHz are represented, if only quickly, on the other monitoring tools, but I can't seem to get them to reflect in real-time on HWiNFO.
 

Attachments

  • Core Clock Screen Recordings.7z
    1.8 MB · Views: 6
That looks like the spikes are very short and difficult to catch. Try to reduce the polling period in HWiNFO and disable monitoring of sensors which you don't need (especially the EC and SMART sensors).
 
Can I trouble you to take a glance at the attached and advise if anything looks off to you? I denoted certain areas in pink borders as per our discussion here, but if you spot anything else, I'd greatly appreciate it if you can let me know.

On the matter of the General/Sensor Settings:
  1. Is there a way to leave "S.M.A.R.T." enabled but to a lesser extent, reducing drive activity/clicking noise? Would that require increasing the "100 cycles" to a higher value? If so, can you advise what the range is of cycles and how they correlate to time?
  2. Given that I have a pair of SATA drives connected (one via external USB and another via internal SATA 6Gb/s, can you advise how toggling "CSMI SAS Support" and "ATA Statistics Support" would impact their drive activity/noise and their sensors reflected in HWiNFO?
 

Attachments

  • 2022-05-23 17 49 18.png
    2022-05-23 17 49 18.png
    55.4 KB · Views: 13
Those settings look OK in case you have no need for the SMART or EC sensors which completely prevents HWiNFO from accessing them.
You can alternatively enable those options back and disable monitoring of particular sensors by hitting the Del key over their heading in sensors screen.

1. Yes, you can enable SMART in global settings and adjust the polling by increasing the "Disk S.M.A.R.T. every" setting. Currently your global period is set to 250 ms, so SMART sensors will be polled each 250 x 100=25,000 ms (25 seconds). You can increase this parameter to a couple of minutes to keep polling of SMART status and minimize the impact.

2. "CSMI SAS Support" has an impact of drive detection, disabling this option might prevent HWiNFO from detecting some drives. "ATA Statistics Support" provides some additional parameters about drives and their health status but it's drive-specific whether it's supported. Some drives can do a spin-up/down when these statistics are polled but with a sufficient large SMART polling period you can reduce this to a reasonable minimum.
 
Take a look at the attached side-by-side screen recording. I made sure to capture both the main settings and sensor settings windows, reflecting revisions to EC sensor toggle, SMART sensor toggle, huge increase to SMART cycles count, and max reduction of global polling period to 50ms. I should also note that I hit "Del" and "Shift + Del" on about half of the available sensors.

In spite of all of the above, lemme know what you make of what you see there.

As my 12900KS employs Intel's newest tech (Thermal Velocity Boost and Turbo Boost 3.0) on two of the performance cores, I'd love to eliminate any other hardware monitoring tools and just go all-in on paid HWiNFO, but there's got to be a reason the other utilities have regular visibility and readout of this turbo clock speed increase when it happens, whereas HWiNFO seemingly misses it each time. Do all the other utilities have some bizarre polling period, or perhaps, some kind of latency/delay on how long they provide a readout?

Any input and expertise you can provide would be greatly appreciated and thank you for all you've done thus far!
 

Attachments

  • HWiNFO vs. HWMonitor P-Core 4 and 6 Turbo Boost Clock Speed Readings (5-24-22).7z
    2.9 MB · Views: 4
No, other utilities don't have any bizarre polling periods.
I believe what you see here is the 'observer effect' - if a utility is sampling the current core clock, this very sampling can cause a particular core to boost to max clock. HWiNFO on the other hand is heavily optimized to minimize this 'observer effect' as much as possible, so you should be less likely seeing it interfering with the current CPU state.
Moreover I can see that the system wasn't under any significant load, so reasons for the CPU to boost its clock are minimal.
Try to put some load on the CPU by running some CPU benchmark or test.
 
@Martin

Take a look at the attached screenshot, wherein Cinebench R23 ran a five-minute single-core benchmark, cycling through the cores and touching the two performance cores regularly. I captured the screenshot at the moment of completion, and you'll see on the right that HWMonitor not only caught 5.5 GHz in the max column for both cores, but it was even reflecting 5.5 in the current column at the moment of screenshot capture.

On the far-left, you'll see HWInfo, with the settings screen open. Polling period is set to 500ms, which I presume is a solid minimum to capture something like fluctuating clock speeds. Nevertheless, HWInfo didn't catch any of the boosts up to 5.5 during the benchmark duration.

I hear you loud and clear on observer effect and how it's important to consider in this situation, but the disconcerting detail here is why the alternative monitoring tools that are inferior to HWInfo at large are, somehow, managing to catch the priority cores when they boost up above of the 5.2 baseline.

Lemme know what you think and thank you for your patience with my delay in between my previous reply and this one!
 

Attachments

  • 2022-06-03 21 45 35.png
    2022-06-03 21 45 35.png
    1.7 MB · Views: 7
Back
Top