You are using an out of date browser. It may not display this or other websites correctly.
You should upgrade or use an alternative browser.
You should upgrade or use an alternative browser.
LogViewer for HWINFO is available !
- Thread starter TomWoB
- Start date
viswagoku
Member
oh.. well the thing is i need to see like 12.. idk i take up 4 windows for 4X3 now that its 5 i need only 3.. i dont need that much detailed view, but need to see all the lines of data, and if you can add a mousehover, (it should display the value of the graph when you point to it) etc. lol
kdk_warhead
New Member
I found this program to be very useful. It produces really nice diagrams and it’s very easy to compare two files. It would be good to be able to sync two files but the “stop watch” method works well enough.
The problem that I can’t solve is that HWINFO doesn’t write the correct end in the log files when the computer crashers (too much OC or heat).
LogViwer reports:
Error occurred: Index is outside the interval…. (In Swedish).
It sometimes works to take an end part from a working file and copy & paste it to the corrupt file in notepad but it’s tricky and doesn’t always work.
Is it possible to make LogViewer accept files without the correct end part?
Attachments
Hi kdk_warhead,
first of all: your file can be openend without any error (?)
second: I know the problem you described, I think the root cause is the following:
sometimes HWINFO adds dynamically new columns during logging! E.g. if you switch on FRAPS, there will be a FRAPS column added in the logfile during logging. Normally this is not a problem, because HWINFO adds in this case a "footer"-line with column information (which contains also dynamically added culumns). Example:
"header with static system or column information" (do not remove)
Date,Time,"Physical Memory Load [%]", ... "GPU Memory Allocated [MB]",
"footer with static system or column information" (do not remove)
Date,Time,"Physical Memory Load [%]", ... "GPU Memory Allocated [MB]","Frames per Second [FPS]",
So, if there is a "footer" available, I take the column information from the footer, otherwise from the header. Your problem is now (I assume) that there are dynamically added columns during logging, but (because of the crash) there is no footer!
What you can try is add some "dummy column information" in the header, I think this will prohibit parsing errors you described above, like:
"header with static system or column information" (do not remove)
Date,Time,"Physical Memory Load [%]", ... "GPU Memory Allocated [MB]",Unknown1 [],Unknown2 [],
I will think about a fix/workaround to handle such problems ...
kdk_warhead
New Member
That was fast!
Strange that you can open it unmodified and I can’t (maybe something to do with Swedish time stamps again?) .
Yes I use fraps to record FPS in HWINFO.
I added "Frames per Second [FPS]", as the last part of the header and it worked! It seems that it is sensitive for any extra spaces or CR but it did work after I tried it three times.
Thank you very much for your help!
I was overclocking my aging water cooled 6970 and I thought it was overheated after some hours off gamming but I can now see that al GFX temperatures is below 50C. “Temp 2” is also steady at 50C until the very end. Then it spikes up to 110C. I don’t know what “temp 2” is but I guess I will have to find out")
Strange that you can open it unmodified and I can’t (maybe something to do with Swedish time stamps again?) .
Yes I use fraps to record FPS in HWINFO.
I added "Frames per Second [FPS]", as the last part of the header and it worked! It seems that it is sensitive for any extra spaces or CR but it did work after I tried it three times.
Thank you very much for your help!
I was overclocking my aging water cooled 6970 and I thought it was overheated after some hours off gamming but I can now see that al GFX temperatures is below 50C. “Temp 2” is also steady at 50C until the very end. Then it spikes up to 110C. I don’t know what “temp 2” is but I guess I will have to find out
kdk_warhead
New Member
I have an ASUS Gryphon Z87 mini-atx motherboard.
Sensor two is connected to the water temperature sensor.
I just updated to the latest HWinfo beta hw64_427_2040.
I can’t see "temp2" in hwinfo but it’s in the log file from Hwinfo…
Also no temperature from Hwinfo correspond to the temperature from “Asus Fan expert” temperature for sensor two. I probably need to enter an offset.
Also the spike in the log file seems to occur at the same time as the screen freezes and the computer stops responding. I think the GPU is overclocked too much and the GFX-driver hangs and coursing trouble.
I believe the temperature isn´t the course of the freeze but it’s a result of the freeze. I will continue with this next weekend.
There is no need for you to think about this. I figure it out eventually
Thanks for the help with LogViewer!
New Version 2.1 available !
Hi all,
I implemented a new version of GenericLogViewer with the following additional features:
Another new feature is that you can create a horizontal line in a "Timeline" diagram:
go with mouse "on curve where the horizontal line should be", wait until tooltip pops up (with value) and click -> line stays there until you click on another tooltip or you change category.
Download GenericLogViewer - Version 2.1
Hope you enjoy my new features ... Tom
Special thanks to "viswagoku" for his beta-testing !
Hi all,
I implemented a new version of GenericLogViewer with the following additional features:
- up to 6 diagrams
- in up to 2 columns (-> max = 12 diagrams)
- Simple mode (for small diagrams)
- Tooltip with horizontal line
- simplifies header and footer
- decreases line thickness
Another new feature is that you can create a horizontal line in a "Timeline" diagram:
go with mouse "on curve where the horizontal line should be", wait until tooltip pops up (with value) and click -> line stays there until you click on another tooltip or you change category.
Download GenericLogViewer - Version 2.1
Hope you enjoy my new features ... Tom
Special thanks to "viswagoku" for his beta-testing !
Very nice tool.
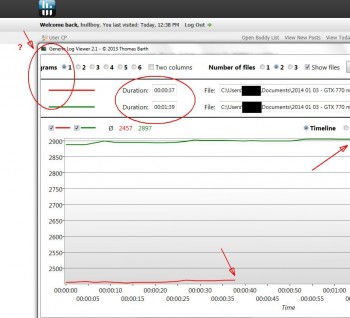
An improvement could be an option to choose the time interval to be displayed, so that you can better compare two (or more) recordings that have different lengths.
Could that be implemented making the "duration" information editable?
For example I'd like to see only the first 38 seconds of both of my recordings (see below)
When I load a diagram the text "Number of diagrams" shifts to the left so that only "... grams" is visible (see below)
Could you investigate why?
My screen resolution is 1280*1024
Thanks in advance")
An improvement could be an option to choose the time interval to be displayed, so that you can better compare two (or more) recordings that have different lengths.
Could that be implemented making the "duration" information editable?
For example I'd like to see only the first 38 seconds of both of my recordings (see below)
When I load a diagram the text "Number of diagrams" shifts to the left so that only "... grams" is visible (see below)
Could you investigate why?
My screen resolution is 1280*1024
Thanks in advance
Hi hullboy,
yes, I agree, making the "Duration" field editable can be a simple solution to define a "time window". In an earlier post of this thread I explained a "manual way" to define the time period which should be shown (see my post from "11-04-2013, 08:12 PM").
Your other problem (only "... grams" is visible) is clear, your screen resolutions is to small . The tool assumes that actual screens have resolutions >= 1400 in width. But it's not an issue, because for smaller resolutions the tool first "hides" useless information like "Number of dia..." (this "feature" is explicit implemented). Important is that you have access to all controls of the tool, this you have !
yes, I agree, making the "Duration" field editable can be a simple solution to define a "time window". In an earlier post of this thread I explained a "manual way" to define the time period which should be shown (see my post from "11-04-2013, 08:12 PM").
Your other problem (only "... grams" is visible) is clear, your screen resolutions is to small
. The tool assumes that actual screens have resolutions >= 1400 in width. But it's not an issue, because for smaller resolutions the tool first "hides" useless information like "Number of dia..." (this "feature" is explicit implemented). Important is that you have access to all controls of the tool, this you have !New Version 3.0 available !
I implemented a new version of GenericLogViewer with the following new feature: Time Window Defintion !
It's possible now
Dowload - GenericLogViewer - Version 3.0
I implemented a new version of GenericLogViewer with the following new feature: Time Window Defintion !
It's possible now
- to show only a part of a single logfile or
- to synchronize multiple logfiles
Dowload - GenericLogViewer - Version 3.0
Is it possible that there's a limit on some values like FPS? A user reports that the Generic Log Viewer doesn't list FPS > 300.
Please check here: http://www.overclock.net/t/1229915/how-to-cpu-and-gpu-usage-along-with-fps-in-game/130#post_23306662
Please check here: http://www.overclock.net/t/1229915/how-to-cpu-and-gpu-usage-along-with-fps-in-game/130#post_23306662
Hi Martin,
YES, you are right, there is a limit of value 300 for FPS !
But ... that's not a bug, "it's a feature". I recognized the following: when you stop a game, PC changes for "graphic mode" to "normal mode". During "this second", FRAPS reports values up to 6000(!) and more. Because of this, the y-axis of a diagram shows values from 0..6000, which is stupid because 99.999% of the logging period the values are typically from 0..150. So, the interesting range of the diagram is too small, because it's only within the first 2.5% of the y-axis.
So, I decided to check the values of FPS and "allow" a max-value of 300, because "in real life" I don't see any use case for more then 300 FPS. Implementation: if there is a value > 300, Generic Log Viewer "takes the previous value" as actual value too. That is/was for me a good solution "to solve the FRAPS value 6000 problem".
Btw, there is "another feature" implemented:
Generic Log Viewer uses maximal 1000 log-values for a diagram. This is a practical solution to have a good performance for calculating the graphs. In my opinion it makes no sense to show e.g. 7000 values when your screen has a 1920 resolution in width and the linewidth of the graph is 2. In case of you have 7000 log values, Generic Log Viewer takes only value 7, 14, 21, 28, ... Believe me, I did test with 7000 value graphs and there was no difference in presentation, except the speed for showing graphs drops down extremly. The only disadvantage can be that maybe "a spike value" is lost in the diagram, but a spike is typically anyway an error in measurement. E.g. I saw temperature log values below the absolute zero point ...
So ... I hope most of the people "agree my practical solution for better diagrams" ...
Best regards
Tom
That makes sense, thanks for the clarification.
However that user is obviously getting a steady FPS of over 300. Would it be possible to have this limit configurable, or raise it to let's say 500 or more ? That would be still pretty far from those nonsense 6000's.
However that user is obviously getting a steady FPS of over 300. Would it be possible to have this limit configurable, or raise it to let's say 500 or more ? That would be still pretty far from those nonsense 6000's.
Hi Martin,
yes, for sure, I can make it configurable, but I think most of the users don't need this feature (-> confusing). Better (and faster) is a trick "to switch of the check". Generic Log Viewer searches for the string "[FPS]" to find/identify the FPS column. So ... you can switch "the FPS 300 check" off, when you change the string "[FPS]" to e.g. "[FPX]" or "[FPSX]" in the header and the footer of the csv-log-file (btw: I assume that "[FPS]" is only in the footer):
Original-Footer:
Date,Time,"Physical Memory Load [%]", ... ,"Frames per Second [FPS]",
New-Footer (disables value 300 check)
Date,Time,"Physical Memory Load [%]", ... ,"Frames per Second [FPSX]",
I think this is a trick which allows "special users" to see more then 300 FPS ...
getintechtom
New Member
Hi Tom,
Sorry to resurrect this old thread. I was hoping you could help me out with your program.
After loading the CSV, all of the sensor are displaying the correct captures, but the time is not showing correctly. I changed to show the time format in excel, but it still doesn't show in your program. Seems to start off at zero and just works its way up.
Please let me know if I'm missing a setting or if the program doesn't allow for the time to be shown.
Thanks,
Thomas
Similar threads
- Replies
- 3
- Views
- 634
- Replies
- 0
- Views
- 345