My thoughtS on this software

Jayson Hans Bourne

Active Member
Hi

WOW! I've used and am using a lot of this kind of software (like HWMonitor, MSI AfterBurner, CPUID, etc. to name a few), but your software, now your software made me sit up and take note. That being said I am not without suggestions, so I will proceed to supply these suggestions in the hopes that you will consider them. It is my first time in your forum and like most people I did not read much before this post, so please just delete it and accept my apologies if I overstepped the bounds of acceptability in your house.

Note that I downloaded HWiNFO a couple of hours ago so these are first impressions.

I noticed the following changes to my system:

1. CPU usage is up by 5% on average (that is after I disabled most voltage etc. monitoring in the app and it is in the tray) causing my pumps to spin up a bit in idle, but I guess that can be expected. I will tweak some.
2. My mouse is jerky and sometimes jumps from one place to another whilst the application is open.

I noticed the following about the program that makes it less fun to use:

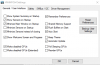
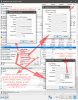
1. OSD: To set up the OSD you need to go into the settings and find the item again when you are looking at the item in the main list. A right-click menu item which only shows the OSD setup portion in a popup will really simplify this.
2. OSD: I noticed that I can add the label of the first item in a row and it will look more like MSI AfterBurner (CPU: 23C, 45%, 1500 RPM), but I do not want that to be the label in the main list. A new field to the OSD setup page called 'OSD Label' where we can specify what to call it in OSD would be great.
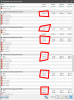
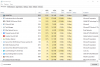
3. OSD: It is impossible to see from the main list information like 'Is this item in OSD and where (row, col)'. Custom columns showing this information would be very helpful. Also a column with the heading (sensor name) so we can reorganize, but still know where the sensor is located.
4. Customize: To customize items (color, label) suffer from the same problems as the OSD mentioned in nr. 1.
5. Interface: If we say could move items around and colorize them and so on and then save that layout so that we can easily switch between layouts, that would be great. Currently you get a warning that sounds pretty ominous when you want to just put something somewhere else. I learned why when I clicked the 'Restore Original Order' button and it disabled 90% of the sensors. I like the original layout, but I would like to be able to switch to a custom layout at times showing only the items I am interested in with my own heading.
6. Interface: If the main headings (sensor names) were tree items that can close items under them and then these items are not monitored until it is opened again it would solve problems I have not thought of yet. I don't know if this will be helpful if nr. 5 was implemented.
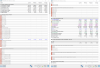
7. Interface: I notice your app will list two entries like 'GPU Core Power' & 'GPU Chip Power'. Each of these show a different value to the MSI AfterBurner 'GPU Power' entry. I assume MSI AfterBurner combines the two to get a value. If we could add entries that combine other entries with a math equation we supply it would help a lot. A good example is the fans in your app only shows the RPM for my motherboard & CPU, but I need the speed as a percentage too for OSD. If I could add an entry that calculates this for me based on RPM it would solve the problem.

I also noticed the following that appears to be bugs, but what do I actually know:

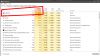
1. The temperatures in the main list shows minus values even thought this option is off in the preferences. I assume because they have only received minus values since the start.
2. Some items in the main list the label in black, but the values are gray. Mostly for the items with minus values (but others too), so I assume you did this on purpose, but it is not clear why.

I downloaded your app for the CPU tachometer monitoring that MSI AfterBurner does not supply, but now I am considering replacing the MSI AfterBurner OSD with your app also since there is a vertical gap between the two app entries (GPU & CPU) and your values don't jump all over the place due to the very useful right-padding.

Kind Regards

Jayson
 
RE: My thoughts on this software...

Thanks for your thoughts, Jayson.
Regarding the increased usage - a slight increase can be expected, but I think 5% is a bit more than expected. The problems with mouse should definitively not happen. I'm not sure why this is, but I suggest to try to disable a few sensors (by disabling the entire sensor heading) and see if you find one that might be causing this. There were some issues in the past with certain storage drivers, which when queried for drive health status could cause excessive system usage. You can verify this by disabling the S.M.A.R.T. sensors or entire Drive Scan.

I'm planning to add more options to OSD configuration, as the latest RTSS introduces text formatting tags. This will be probably a more complex change, so it might take time until the best approach is found and implemented.

Regarding GPU Core and Chip power, I don't think MSI AB is combining them, it rather reports only one of those values. Their meaning has been explained on this forum, most important note about power measurement is that it's never 100% accurate as the GPUs don't truly monitor all voltage rails, so some of them are just estimated. But the values you see are the same ones as those used by the GPU internally.

Grey items in the list mean that the last sensor readout returned an invalid value. If you see negative values, they might come from sensors which are not really connected on the mainboard. Attaching a screenshot with more details about the system would tell me more. But generally, such values can be ignored (and hidden/disabled by user).

I know that customizing the entire sensor screen layout might be difficult for users in some cases, but I was already thinking about other ways how to change this. Truth is that due to the large amount of various sensors supported and extensive configuration options available the implementation is very tough.
Also each user has different preferences and expectations. I'm sure that if I would make big changes to the layout, I would get lots of requests to put it back :D
 
RE: My thoughts on this software...

Hi Martin

So refreshing to see you are evolved with your own forum. So many developers use a forum to shun their responsibility towards their creations.

I have also noticed that when I minimize and restore windows now they do not animate smoothly. I cannot place the blame yet, because I was having my fair share of problems before your magic software entered my PC. I think like 'Total Commander' this app will soon become a vital part of my PC experience.

I have disabled the SSD monitoring, but will restart later to be sure since there is no change. I hope it is not that because your app is the only one so far that displays all the info correctly regarding my SSD and I need the temps for the liquid cooling solution I am adding to it.

Here are my specs if you are interested:

Intel Core i7-6700K Skylake CPU
Gigabyte Z170X Gaming G1 Motherboard
2 x 16 GB One-Sided Kingston HyperX Fury RAM Modules
1 x Radeon RX 480 G1 Gaming 8G Graphics Card (Soon to be two)
Samsung SSD 950 PRO 512GB Storage Drive
Samsung P2770FH 27-Inch Full HD LCD Monitor (Rose Black)
1 x Old 720W Gigabyte Odin PSU (Computer)
1 x Old 450W AOpen PSU (Liquid cooling parts)

I had problems with just the 720W (beige screen system crash when playing 3D games) so I'm testing the split config I have listed and it works very well. I am waiting for a specific Gigabyte 1200W PSU to be available in my country then I will add the second graphics card. I am however loving how the pumps spin up when I switch the 720W off getting rid of any residual heat left in the system (especially when it just crashed after overheating).

Kind Regards

Jayson

EDIT:

I have restarted and offer you the following screenshots. You will see very quickly what is troubling me:

Pics ending in App#-# are the pages of your app (PageDown)
The other two are from Program Manager and Gigabyte's own sucky software.
The CPU drops to about 2-3% when I completely unload your app.

Jayson
 

Attachments

  • HWiNFO TaskMan.png
    HWiNFO TaskMan.png
    47.7 KB · Views: 9
  • HWiNFO GigabyteThermalConsole.png
    HWiNFO GigabyteThermalConsole.png
    50.9 KB · Views: 8
  • HWiNFO App1-2.png
    HWiNFO App1-2.png
    125.4 KB · Views: 8
  • HWiNFO App3-4.png
    HWiNFO App3-4.png
    123.7 KB · Views: 7
  • HWiNFO App5-6.png
    HWiNFO App5-6.png
    132.7 KB · Views: 12
RE: My thoughts on this software...

Well, I see you have lots of sensors on the system :)
Not sure which one exactly might be causing the higher load, but some ideas might be the different IRF sensors on the mainboard, or the additional GPU sensor.
You might also try to disable GPU I2C support in HWiNFO to see if that helps.
 
RE: My thoughts on this software...

Hi Martin

When I switch the item you mentioned off the CPU almost immediately drops down to normal-ish idle values, and does the reverse when I switch it back on:

GPU [#0]: AMD Radeon RX 480: CHiL/IR PMBus - GPU Core
I assume this is what you meant with 'additional GPU sensor'.
Disabling GPU I2C support made it not show after a restart of your app.

Now my PC runs a gentle 26C at 955 dual pump RPM as before.

Also... It lists 'Fan4' & 'Fan5' (HWiNFO App5-6.png), but they have weird readings and I do not think they exist (Other softwares also sometimes add up to 7 of them over a period of time under a PWM heading). I assume these can also be ignored.

Kind Regards

Jayson
 
RE: My thoughts on this software...

Yes, that was the sensor I meant. So great that you found the guilty one :)
It's a bit weird, since that sensor should usually list several values, but in your case it looks like HWiNFO is unable to read from it. That might be probably also causing the higher CPU load.
Disabling GPU I2C support will completely skip accessing such sensors.

Fan4/5 looks like a temporary erratic readout.

Are you maybe running multiple similar system monitoring tools in parallel? That might be causing such issues.
 
RE: My thoughts on this software...

Hi Martin

That sensor was definitely the sole reason for the high CPU load. But alas... unfortunately I am not done with you yet...

I am running the following monitoring apps:
1. Standard Gigabyte monitor as you saw in the screenshot, but only because I don't completely understand/trust your app yet. I will switch this off for a test later.
2. AfterBurner is also running for GPU tray info since your app seems to have problems there as the screenshot included here will show. The left part of the image is with a solid background and the right part with transparent. Your value is marked in red. Once I selected transparent it disappeared and now I cannot access the background color itself since it is permanently disabled, even when I deselect 'Transparent'.
3. Task Manager is currently always running on my system to sort out an internet problem.
3. Gigabyte's EXTREME GAMING ENGINE is controlling the GPU overclocking and fans, but I will get rid of this evil software as soon as I find another way to change the GPU led colors, plus its monitoring is off.

I'm not sure but all my games (lol, I mean Age Of Empires 3 which is all I could find to put on for testing) work fine, but when I start your app there is what looks like lag every second or so and then it catches up again (like pause/play). It does this all the time. Then when I close your app it keeps on doing it. Only a restart fixes it. Worth investigating I guess since it was smooth with AfterBurner. Maybe you know something about it.

Also I see on the labels a lot of sensor names that are the same (i.e. 'GIGABYTE Z170X-GamingG1 (IRF IR3570)' appears several times). Is this common or is this an error and the dupes should be disabled?

Kind Regards

Jayson
 

Attachments

  • HWiNFO TrayIcon.png
    HWiNFO TrayIcon.png
    12.4 KB · Views: 5
RE: My thoughts on this software...

Sorry, but I cannot reproduce the problem with tray icon background color. If I deselect Transparent I can access the color without problems. Could you please attach a screenshot, that would show what exactly happens ?
Yes, that multiple sensor is normal, each of those sensors measures a different voltage rail on your mainboard.
 
RE: My thoughts on this software...

Ah yes.. you have to deselect the "Depends on alert threshold" too as this determines the background color as well.
Sorry that this is not obvious when that setting is not placed next to background color.
 
RE: My thoughts on this software...

Hi Martin

Also if you make it white it disappears completely. Did you see in the video I had to mix in a bit of gray.

Bigger than that problem is this one. When I disabled the GPU I2C support I also lost my FPS and that will never do. When I re-enable it the pause/play problem comes back. What am I to do to remedy this?

Kind Regards

Jayson

EDIT

Now the FPS is back. It seems to take a while to show up after Windows starts.
 
RE: My thoughts on this software...

Yes, a pure while color (255,255,255) means transparent. I will need to somehow change the color assignment so that the user is aware of this.
 
RE: My thoughts on this software...

Hi Martin

Pure white may possibly have been the worst color to choose, because Windows 10 has almost exclusively white icons in there. No matter.

This was the first time I had it start with Windows and it still asked me which interface to load and then froze up during load for about a minute (not kidding). I probably have one of the settings wrong so please check the image I have included.

I may have to set it not to start with Windows and then throw its link in the delayed startup folder.

Kind Regards

Jayson
 

Attachments

  • HWiNFO StartupSettings.png
    HWiNFO StartupSettings.png
    10.6 KB · Views: 3
RE: My thoughts on this software...

Pure white is not the color I have chosen for transparency, it's a system-wide color.

If you disable the "Show Welcome Screen and Progress" option, you should get no GUI during startup.

That freezing is probably caused by a too early startup when some of the required services were not started yet. This depends on particular system and can be adjusted.
Using the Auto start option in HWiNFO creates a Windows Task. Open the Windows Task Scheduler and adjust (raise) the startup delay for the HWiNFO task.
 
RE: My thoughts on this software...

Martin said:
If you disable the "Show Welcome Screen and Progress" option, you should get no GUI during startup.

Please fix the tooltip. It says this will not affect startup. I will test later.
 
RE: My thoughts on this software...

Hi Martin

You said in an earlier post to me that you are planning to change the user interface to be more user friendly, and believe me I understand that this will be a mammoth task that cannot be entered into lightly.

As a user of your software I offer you this image to help in your idea formation process. This will be my last word on the matter, so I will leave you to do your thing.

Kind Regards

Jayson
 

Attachments

  • HWiNFO UISuggestion.png
    HWiNFO UISuggestion.png
    164 KB · Views: 6
RE: My thoughts on this software...

Thanks for your suggestions, I will consider that.
Perhaps something less extensive, as the highest priority for me is still excellent and reliable hardware support.
 
RE: My thoughts on this software...

Hi Martin

I installed Visual Studio Community Edition and now as you will see on the screen captures HWiNFO has serious issues.

1. It uses 30 to 40 percent of the processor when it starts with Windows and remains that high until I close it (HWiNFO HiCPUVS000.png).
2. I have it on a 10 second delay for startup.
3. It started fine this morning before VS installation.
4. It reports 0.0 for all those lower down sensors (HWiNFO HiCPUVS001.png).
5. It reports the CPU temperature as 25 when clearly it is much higher by the pump noise and the Gigabyte software reports it at 34 degrees.

What to investigate/do?

Kind Regards

Jayson
 

Attachments

  • HWiNFO HiCPUVS000.png
    HWiNFO HiCPUVS000.png
    55 KB · Views: 5
  • HWiNFO HiCPUVS001.png
    HWiNFO HiCPUVS001.png
    80.7 KB · Views: 4
RE: My thoughts on this software...

I can't imaging how could VS have impact on this.
When you close HWiNFO (after auto start) and then start it manually again, do these issues persist?
 
RE: My thoughts on this software...

Hi Martin

Something different happens. The processor shoots up to 44% but the interface never loads. Just nothing. Not even a tray icon for me to feast my eyes upon.

Kind Regards

Jayson

EDIT: Here is a video depicting the above if you are interested:
https://1drv.ms/v/s!AquLpYDQpmXJhD0ZtzfotyL3Oo0-
Don't worry about high CPU at start of video. Corel capture sucks a bit.
 
Back
Top