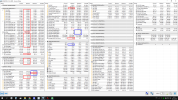
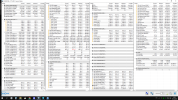
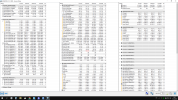
Strange readouts after unfolding minimized window of HWInfo

dimkatsv

Active Member
System configuration:
Motherboard: Gigabyte B550M Aorus Elite
CPU: AMD Ryzen 5 5600X
GPU: AMD Radeon RX 6750 XT
RAM: 32GB 3800 16-20-20

These readouts happen after HWInfo for some time gets minimized. Usually it is just Core VID, Core Clock, Per Core temps and Core utilisation getting minimized at 0.0
But sometimes it is also CPU die (average) being significantly over 100 degrees without showing thermal throttle (not that it is even possible, my system cannot physically get more than 85 degrees on CPU no matter situation and ambient)

Will try BETA version, maybe it will behave differently.

1659474969342.png
 
Last edited:
When you minimize HWiNFO does it perhaps appear as Suspended in Task Manager? Also do you have virtualization (i.e. Hyper-V or HVCI) enabled?
 
When you minimize HWiNFO does it perhaps appear as Suspended in Task Manager? Also do you have virtualization (i.e. Hyper-V or HVCI) enabled?
Hmm, idk about it being suspended, as it is not laptop, i should have no power regulations. But i definitely don't use virtualisation, it is main system.
With latest beta i yet managed to get only minimum 0.0 MHz effective clocks once, but voltages and other values were at all right
 
We shall wait to see if you will encounter the problem with latest Beta.
 
Well, 2 days in. Min core effective clock still can be showed as 0.0 MHz after some time idling (usually on 5/6 cores as 6-th is one HWInfo is tied to, but it still can also be 0.0 MHz on all 6 cores for some reason), which is unrealistic. But i had no additional issues (aka with voltages and strange temp readings)

UPD: got overvalued "CPU Die temp (average)" again.
Voltages and core clocks still look fine though

UPD2: Got 0.000V again at Core VID. And in addition, min per core temps and per core L3 cache temps are also 0.0 degrees, somehow
 
Last edited:
Are you perhaps running some other monitoring or system tweaking tool along with HWiNFO?
Collision with such tools can sometimes result in such glitches in readouts.
 
Are you perhaps running some other monitoring or system tweaking tool along with HWiNFO?
Collision with such tools can sometimes result in such glitches in readouts.
Hmm, i do use RTSS and MSI Afterburner, but they did no collisions before.
Can AMD Adrenalin cause that collision? Because this is basically only difference in monitoring utils i have from previous config?
 
Theoretically the CPU monitoring component might collide but I'm not aware of any such observations yet,
 
I have the exact same issue with my 5900X and also tried my “old” R5 3600. The 3600 is producing same readings but not so often or as easily as the R9 5900X.

5900X starts with zeroing firstly the effective* clocks some times within a few minutes (if not secs) and after this it can take 30 min or 3 hours to zero everything else like the OP’s screenshot.
3600 can pass sessions for hours (not always) until it shows (if it shows) such readings.
Haven’t really observed how discreet clocks behave but at least on 5900X are showing zero at some point all together (from a minimum of 3.3~3.275GHz) or at least 1 CCD at the time.
I’m getting always an alert (only for 5900X) from a specific core about discreet clock going to zero.
Core6 and this is the first core of the second CCD. When I bring up sensors window and before I click OK on the small alert window, I’m seeing always the first 6 (0-5) discreet clocks already at zero and the other 6 (6-11) showing the minimum clock.
Once I click ok then all 12 discreet clocks are zero and the picture pretty much looks like the OP’s screenshot.

(*last eff clocks to show zero are the 2 first cores of the CPPC order, the most active ones)

The odd thing, other than all this behavior alone, is that the CCD going to zero firstly on discreet clocks is the one having the first 6 best CPPC) cores.
In other words, it’s somewhat the opposite of what happens with eff clocks.

I think has something to do with how the CPU is idling or behaving in low loads. Web, streaming videos …etc

Firstly I was blaming the curve optimizer of 5000 series, but I saw it also with 3000 so… and also disabled it just in case.

It’s been like almost 2 weeks now, and I think this started after a windows update.”, now that I’m thinking this the last few days.
Could be wrong though.

My OS is Win10 21H2

I think I tried to run system with AMD virtualization Off, at the start of issue.
I could try it again.

Also wanted to run system stripped of other software too but haven’t found the time yet, as this could take a few hours of usage.

I really don’t know if I helped or mess things even more.
 
5900X starts with zeroing firstly the effective* clocks some times within a few minutes (if not secs) and after this it can take 30 min or 3 hours to zero everything else like the OP’s screenshot.
3600 can pass sessions for hours (not always) until it shows (if it shows) such readings.
It can happen at any time. And usually can happen incrementally, like 0.00 on only 2 or 4 cores. But in the end all values go wild sooner or earlier, usually over from 30 mins to 1 day
 
I have the exact same issue with my 5900X and also tried my “old” R5 3600. The 3600 is producing same readings but not so often or as easily as the R9 5900X.

5900X starts with zeroing firstly the effective* clocks some times within a few minutes (if not secs) and after this it can take 30 min or 3 hours to zero everything else like the OP’s screenshot.
3600 can pass sessions for hours (not always) until it shows (if it shows) such readings.
Haven’t really observed how discreet clocks behave but at least on 5900X are showing zero at some point all together (from a minimum of 3.3~3.275GHz) or at least 1 CCD at the time.
I’m getting always an alert (only for 5900X) from a specific core about discreet clock going to zero.
Core6 and this is the first core of the second CCD. When I bring up sensors window and before I click OK on the small alert window, I’m seeing always the first 6 (0-5) discreet clocks already at zero and the other 6 (6-11) showing the minimum clock.
Once I click ok then all 12 discreet clocks are zero and the picture pretty much looks like the OP’s screenshot.

(*last eff clocks to show zero are the 2 first cores of the CPPC order, the most active ones)

The odd thing, other than all this behavior alone, is that the CCD going to zero firstly on discreet clocks is the one having the first 6 best CPPC) cores.
In other words, it’s somewhat the opposite of what happens with eff clocks.

I think has something to do with how the CPU is idling or behaving in low loads. Web, streaming videos …etc

Firstly I was blaming the curve optimizer of 5000 series, but I saw it also with 3000 so… and also disabled it just in case.

It’s been like almost 2 weeks now, and I think this started after a windows update.”, now that I’m thinking this the last few days.
Could be wrong though.

My OS is Win10 21H2

I think I tried to run system with AMD virtualization Off, at the start of issue.
I could try it again.

Also wanted to run system stripped of other software too but haven’t found the time yet, as this could take a few hours of usage.

I really don’t know if I helped or mess things even more.

Do you have the "Snapshot CPU Polling" option enabled? Would be interesting to know if you see a different behavior with this option enabled or disabled.
 
Do you have the "Snapshot CPU Polling" option enabled? Would be interesting to know if you see a different behavior with this option enabled or disabled.
Always enabled long time now, I will try also without, but I got to install back the 5900X and this could take a couple of days. R5 3600 is doing this very rarely but 5900X was like every time since this came up.
 
Hmm... situation is a bit different without snapshot polling
Core and L3 temps with Core powers again are out of whack
Min voltages are now 0.2 and not 0.0
Core clock is now 2940.0 instead of 0.0 (still less than 3.67 base clock it supposed to be.
And not every core got 0.0 MHz effective clock.
1660212502091.png
 
That looks more normal but its not. Still some zero(s) were they shouldn't be.
For example minimum Core Usage/Utility. minimum Average Active Cores.
And that minimum Core C0 Residency... How none core is active even for a fraction of a sec...


Minimum descreet clock is not suppose to show base clock. The core clocks can go below base depending the windows power plan, before they enter a sleep(C1) or powerdown(C6) state.

And VIDs are not what the cores are getting. VIDs are what the cores request. What the CPU cores are getting is the "CPU Core Voltage (SVI2 TFN)".
 
Last edited:
Thanks. Can you please try without AMD Adrenalin or at least its CPU monitoring agent? I suspect that this problem might be due to a collision with it.
If that won't help, it would be great if you could capture the problem in HWiNFO Debug File and attach it here. The file might grow pretty large when running longer, so you might need to compress it or upload elsewhere.
 
Back
Top