Strange readouts after unfolding minimized window of HWInfo

Not directly because of that, but as a side effect of the Adrenalin package polling the CPU. Later Adrenalin drivers also include a CPU monitoring/polling agent that I suspect might be causing this.
I never tried to uninstall separately the CPU agent, nor don't know if that's possible. AFAIR there was a separate AMD service for CPU monitoring, so perhaps disabling that might do the work. If not, either rolling back or uninstalling the entire package might be the only way.
This is just to prove if those hiccups in reading some CPU parameters in HWiNFO might be due to that.
 
I said previously that this issue might be due to windows update, but it could be from GPU drivers update as I did this also lately.
I'm going to try drivers from early 2022 and even from 2021, using DDU in safe mode to uninstall.
 
Not directly because of that, but as a side effect of the Adrenalin package polling the CPU. Later Adrenalin drivers also include a CPU monitoring/polling agent that I suspect might be causing this.
I never tried to uninstall separately the CPU agent, nor don't know if that's possible. AFAIR there was a separate AMD service for CPU monitoring, so perhaps disabling that might do the work. If not, either rolling back or uninstalling the entire package might be the only way.
This is just to prove if those hiccups in reading some CPU parameters in HWiNFO might be due to that.
Well said Martin!

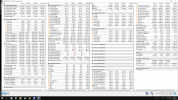
1660232848635.png

An hour of browsing, streaming videos and some web gaming

This is with Adrenaline 22.1.2 (Jan 18 2022) and it seems normal now. Usually when issue occurred before, I started seeing zeros on effective clocks in a few seconds/minutes
 
Well said Martin!

View attachment 8080

An hour of browsing, streaming videos and some web gaming

This is with Adrenaline 22.1.2 (Jan 18 2022) and it seems normal now. Usually when issue occurred before, I started seeing zeros on effective clocks in a few seconds/minutes

Thanks. Let's give it some more time to be sure..
Then I'd like to suggest to go back to latest Adrenalin and try to catch the issue in DBG file which I will analyze and see if I can come up with some workaround.
 
I have a DBG file with Adrenalin 22.5.1, latest WHQL, JUN 14 2022, 53MB (zipped, original ~440MB).
Where can I upload it thats easy for you to get?
 
I have a DBG file with Adrenalin 22.5.1, latest WHQL, JUN 14 2022, 53MB (zipped, original ~440MB).
Where can I upload it thats easy for you to get?

Does that file capture the problem, do you maybe recall which values dropped to 0 during the run?
I currently don't have any dedicated space for uploading large files, so up to you.
 
Was like this, although this is older one

HWiNFO64_138min_Odessey.png

Well, I dont have a clue where I can upload such a file.
 
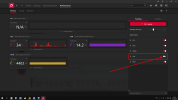
Hm... it seems after switching this off i don't get strange values anymore. Guess this is a causation. Will try to disable debug mode and turn Snapshot CPU polling on back and check again
1660312332295.png
1660312398844.png
 
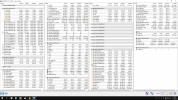
Finally, after total of 2 days with debug on (with some resets to reduce file size, i managed to catch 0.00 frequencies and 0.0 core count over night of foreground. No BS temp or voltage values though.
1660390158371.png
File is around 2.7 GB big, but i compressed it to around 77.5 MB
Link to debug file. Looked myself at first, no idea what to look for in it, ngl.
 
Thanks! I have analyzed the raw data and came to the conclusion that this problem isn't in HWiNFO but in the CPU/SMU. The data HWiNFO shows is what the CPU really reports.
 
Thanks! I have analyzed the raw data and came to the conclusion that this problem isn't in HWiNFO but in the CPU/SMU. The data HWiNFO shows is what the CPU really reports.
Wow, now that's unexpected. Any idead about how this is happening?
I doubt that PC can run minimized game and still report 0.00-s
 
I don't know why it happens, this is something deep inside the CPU/SMU. Probably some occasional glitch in reporting.
 
Hmm... Sorry, but i will conntinue this thread despite several months passing.
Can it be something related to Windows 11 policies? Even though i do have Core Isolation disabled and no Hyper-V?
Because i have 2 deep CPU monitoring tool, one is with normal priority library, and second with Ring 0 level (yeah, this one is dangerous to have and/or use).
And i noticed that one with normal priority will also misreport values randomly as both 0000 as well as complete nonsense, slow down HWINFO report when there is heavy load and occasionally conflict with something leading to it's force close.
While tool that uses Ring 0 access have no problems at all and i run this one for quite some time trying to monitor behaviour on deeper level.
 
What do you mean with "2 deep CPU monitoring tool"? Are you running multiple monitoring tools alongside? If yes, the problem could be due to a conflict between them.
 
Back
Top