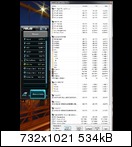
CPU, wrong temperature.

nobbi

Member
Hello,

Excuse for my bad English. I use HWInfo to select of the temperatures, to me has struck a value cannot be right. It concerns the CPU temperature which should be according to HWInfo in the Idle under the ambient temperature. Nevertheless, this cannot be, or?

System:
Board: Asus P8P67 Rev.3.0
CPU: Intel i5 2500K
Ram: G.Skill Ripjaws 2x4GB 1333 MHz
Graphics: Gigabyte GTX460 OC

Tested with the new version of HWInfo64 3.92-1500

 
Hello,
please try to run the ASUS AI Suite together with HWiNFO and let me know what CPU temperature that displays.
Best would be to make a screenshot of both tools side by side and also attach the Debug File.
 
Then I'm sorry, but there's nothing I can do about this, since I have to trust the ASUS own tool.
 
Ok, no problem, many thanks. The temperature was very low, but then probably OK.
If the DBG file in order?
 
Martin said:
Then I'm sorry, but there's nothing I can do about this, since I have to trust the ASUS own tool.

Martin, Just a FYI in case you are not aware of this. I own an ASUS SaberTooth P67 board, that uses ASUS's AI Suite II monitoring and utility programs, including their Thermal Radar application. That is similar if not identical to the ASUS program the OP is using.

After I updated the UEFI on this board (a few UEFI updates ago), the CPU temp (not core temps) Thermal Radar reports suddenly dropped by ~10C or more, the idle temps being the lowest. This temp difference is also seen in the UEFI. I was getting sub-ambient CPU temps at idle, which I knew was wrong. I flashed the UEFI back to the previous version, and the CPU temp magically returned to the values I normally saw. Flashed back to the new UEFI, and the CPU temp was again at least 10C lower.

To make a long story short, I finally found in the release notes of a UEFI update for a different ASUS P67 board that they had changed the CPU temp reading from Tcase (or Tjunction, I forget) to a sensor in the CPU socket, I believe.

The main thing that helped me realize this was HWiNFO64. Your "CPU Package" (the Original Name for that data in your Configure option) temp reading did not change after the UEFI update (of course.) It's value did match the value shown in Thermal Radar with the earlier UEFI. The difference between the two after the UEFI update is what helped me realize what had happened, in general.

Best of all, your "CPU" temp reading (a different reading than CPU Package) shows the same value as the incorrect/different temp reading shown in Thermal Radar! That really confirmed for me that ASUS had switched what data was used to display the CPU temp.

IMO, ASUS did this due to complaints from some owners of their P67 boards about the CPU temp being to high when using the UEFI. Since none of the CPU power saving options are active while using the UEFI, and it apparently uses one core of the CPU at a high level, almost 100%, the CPU get a little warm with the stock cooler, poorly installed coolers, and/or poorly ventilated cases. I really don't know if that is true, but several UEFI versions later, and after my submission of a problem report to ASUS, and ranting about it in their forum, nothing has changed. Regardless, IMO it is a dirty trick, potentially dangerous to the users hardware, and shows disrespect for their customers.

So let me thank you for creating and maintaining a honest and reliable PC hardware monitoring tool, it is the ONLY one I use on all my PCs. Not that I think you would, but please don't ever change what temperature data you display because someone thinks it is wrong, or are pressured to do so for some reason. As I write this and glance over at the HWiNFO64 Sensor Status display, the cores of my i7-2600k are usually idling at 1.6GHz, but change occasionally to the OC speed of 4.6GHz. My real CPU temp varies between 25C and 30C, while the ASUS CPU temp, that I can also see as I said, is showing 14C - 15C. While it is winter where I am in the US, I can assure you that my room temperature is not 60F or less.

Excellent work Martin, thanks so much!

PS: If you run HWiNFO at the same time as Thermal Radar, Thermal Radar gets bad data for some reason, and issues random warnings about temps, voltages, etc. Thermal Radar does that when most any other hardware monitoring program is running, in my experience.
 
Thank you for the feedback. I'm really glad that you find HWiNFO useful and it helped you to diagnose such issues.
I have no plans to remove values from the current sensor list, although some other tools prefer to be exactly in sync with manufacturer tools and values which do not match are removed. I still think that some sensor values reported which are not included in manufacturer tools might be valid (or might be left for debug purposes). Their meaning just needs to be determined (as this case has shown).
I'm aware of the problem with concurrent run of HWiNFO and Thermal Radar. It's because both tools read certain values from the Embedded Controller (EC) and unfortunately, there's no synchronization method available to solve a potential conflict when both tools access the chip at the same time. It's a bad interface design, but I don't think there's another alternative how to access this EC. Some developers have already asked ASUS to implement a synchronization with Thermal Radar or make a better interface, but as far as I know, ASUS ignored this.
So the only workaround currently is to disable reporting of the "ASUS xxxx EC" values (or disabling the entire sensor) in HWiNFO in case you don't need these values to be monitored. That should 'fix' the issue.
 
You are welcome Martin. I don't blame HWiNFO for issues with Thermal Radar, as I said, I have seen other monitoring programs do similar things, the Intel Desktop Utilities program literally locks up in some cases, as well as gets bad data and issues false warnings if virtually any other monitoring program is running. I've wondered why some programs like this "break", but others like yours don't.

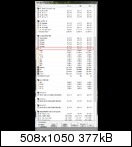
I'm a technical person, would you mind telling me in general terms what data is being read that is displayed in your "CPU" display, found under the sensor chip heading (I assume, displayed as Nuvoton NCT6776F on my board) in contrast to "CPU Package", found under the "Intel CPU#0" heading.

I've also found that in the AI Suite II program, in it's Settings option, you can disable (uncheck) the Monitor function (all the temps and CPU frequency), which allows the rest of AI Suite to run concurrently with HWiNFO64 just fine, that is how I use them. Another workaround on AI Suite's side, IMO.

I certainly don't need two temp displays on the screen at once, since HWiNFO shows all the temps available on that board (thanks BTW, I can't believe the P67 PCH runs so cool compared to other Intel chipsets.)

So concurrent reads of those data registers causes data corruption? Interesting, I've always wanted to learn how that data is read. I've seen the Intel register documents for their CPUs.
 
Please attach a screenshot of the sensors window so I see more precisely which values should I explain.
The EC (Microcontroller, which actually is a small processor running its own firmware) access method is realised via I/O operations and the protocol is problematic. Let's say tool1 sends a command to this chip and waits for response. But if in the same time tool2 sends other command or waits for other response, then the result is a conflict. The protocol doesn't feature an interlocking mechanism, which is a design fault.
 
Back
Top