AL13N
Member
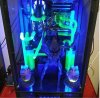
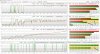
My 2nd 2080ti is going dead during gaming, all LED's go dark on the card and the NVLink and the whole system freezes up and I have to reboot. This only happens in SLI games, Rendering Benchmark files with Blender or using TimeSpy or Heavens Benchmark are all fine, no issues. I'm talking to EVGA on an RMA with the card but they want me to disassemble the whole system, reinstall the Air Cooling on both cards, swap the cards in the slots to determine a card or slot issue. They even say it could be a bad NVLink bridge. As you can see from the pic, that would be a tedious job. I have a Log file from HWInfo but it's full of millions of numbers in Note Pad, that to me don't make any sense. So what I'm asking is, is there a way to read this file to determine the problem? Maybe I need the SDK version which I am willing to get. Any help would be greatly appreciated to keep me from tearing the whole thing apart.
[attachment=3511]
Thx,
Dave
Case: ThermalTake The Tower 900
MOBO: ASUS x399 Prime
Processor: ThreadRipper 1950X
Cooling: Phanteks Glacier Series PH-C399A_CR01 GLACIER C399A - Mirror Chrome
GPU: EVGA GeForce RTX 2080 Ti BLACK EDITION GAMING (x2)
Cooling Block: EVGA Hydro Copper Waterblock (x2)
Cooling Tower: ThermalTake Pacific PR22-D5 (x2)
Radiator: Pacific CL360 (x2)
Fans: Thermaltake Pure Plus 12 RGB TT Premium Edition (x6)
LED: Pacific Lumi Plus 3 Pack
Drive: SAMSUNG 970 EVO M.2 2280 1TB
Memory: Corsair Platinum 32GB (4x8 GB)
PSU: EVGA SuperNOVA 1200 P2
Monitor: Acer Predator Gaming X34
OS: Windows 10Professional (64-bit)