Hey guys.
I have a Zalman HP PLUS 750W PSU for 8 years now.
I was running a stress test on my PC (MSI Kombustor Burnin test + CPU Burner) and I logged that 3min test to a .csv file.
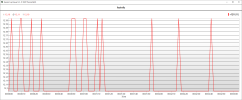
I am attaching the chart here and although I know we have +/-5% of variance for those lines, is it normal to see it vary like in the chart?

Just curiosity.
I am really in doubt if I should replace my PSU as I got a new 4070 TI (+ Core i5 12600K).
Thanks!
I have a Zalman HP PLUS 750W PSU for 8 years now.
I was running a stress test on my PC (MSI Kombustor Burnin test + CPU Burner) and I logged that 3min test to a .csv file.
I am attaching the chart here and although I know we have +/-5% of variance for those lines, is it normal to see it vary like in the chart?

Just curiosity.
I am really in doubt if I should replace my PSU as I got a new 4070 TI (+ Core i5 12600K).
Thanks!
