Inconsistent polling period logging?

Good day, all! I use this software to record data during testing. For this test/purpose, I use Hwinfo (7.20.xx) with AIDA64 Engineer and run the stress test (CPU/FPU/Cache are checked) concurrently. Lately, I've been having issues with the polling rate not matching the log/dataset count. Basically, I need a data point every second for the duration of my stress test (30 mins). Initially, I started around 800ms to capture that dataset...but now I'm down to 325ms and it's still falling hundreds of data points short (across 30 mins Im getting around 1500 data points instead of 1800).

Worth noting, I use the same M.2 drive and OS for multiple tests/motherboards. In other words, it isn't a 'fresh' installation but one that has 'installed' multiple motherboards. I tried a Sysprep on it to clear out other hardware IDs, etc, same result. I also test at stock, and while overclocked... both environments yield the same result (not enough data points) though there is a difference in the amount captured between them (ironically, the OC captures LESS data points even though it's 'stable' - adding voltage to it doesn't help.

So, how do I get a consistent polling rate during stress testing to consistently capture the correct amount of data points?

Thank you all!

EDIT: Some system information may be helpful, along with some screenshots, lol!!

12900K
Z690 motherboards (many)
2x16GB GSkill DDR5 5600
Phison 2TB PCIe M.2
Windows 11 (mostly updated)
Hwinfo version (7.20.xxx)

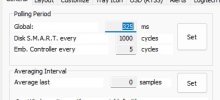
hwinfo1.jpghwinfo2.jpg
 
Last edited:
The exact polling period might be affected by polling of some sensors, especially those that take a relatively long time to read.
To examine this I recommend to enable the "Profiling Time" column in sensor settings, then check which sensors taking a lot of time to read and if you don't need those, disable their polling.
This should then allow more consistent polling periods.
Also note that the system timer is not very precise with usual precision of up to 16 ms.
 
Thank you for the response!! :)

In this case, it looks like the motherboard sensor (Asus) is taking the longest(400+ms). It's mostly 0's outside of the RAM (16/17ms) and videocard (20-23ms) though...the thing is... I need that sensor from the motherboard in most cases as I'm measuring something that sometimes it only picks up (like VRM temperatures, for example). Testing now with it disabled as well as the RAM and Videocard..so everything is 0's... I'll edit in 30 mins or so.

It's curious though I used to be able to set somewhere around 825ms and now in order to get 1 second intervals in the log and now it needs to be set much lower.


EDIT: Ok, that seems to work, though I'm still 'stuck' at (what I feel is) that lower value to capture data as close to every second as I can.

Also note that the system timer is not very precise with usual precision of up to 16 ms.
To be clear, I should just shoot for 1800 data points with manually timing things (like from my phone, for example) as the 'time' in the log there can be off...correct?
 
Last edited:
The time in the log determines when the entire sensor set has been read and can also be delayed by the disk operation needed to write the log. You will never be able to achieve exact timing with millisecond precision - Windows is not a real-time operating system and other tasks can also preempt HWiNFO. So the results will also depend on type of actual system load or other high-priority tasks in system.
 
Thanks again!

I understand what you are saying. I just wanted the time recorded in the log to match my intervals consistently and, from what you are saying, it can't really. My system load remains the same (AIDA64 stress test) as does the OS for all of these boards I test. Literally, the only difference is the board and lately, it seems I have to change the polling rate with every board. Whereas previously, I didn't have to do that and could test several boards in a row without making that adjustment.

Oh well, it is what it is. Thank you for the awesome software and support! :)
 
That's right - the resulting rate will not be consistent on all systems as it depends on other factors too. Besides the actual system conditions/load, also sensors that take excessive time to read (close to or above the actual polling rate) will result in a delayed sampling interval. So you will have to adjust the period for each system to match actual conditions.
 
I guess the curious part is that I could leave the polling rate alone before and now (I'd say around Z690 time and w/e version came out around then) feels like the software is more 'sensitive' to external factors. I could literally drop in several boards and not have to touch the polling rate (and there wasn't a lot of headroom to play with). Now, I have to play and test each board as the difference is typically significant.

Hopefully lopping off the GPU/RAM/Asus chip helps. :)
 
Alternatively you might set up a much larger polling period individually for the EC or SMART sensors. Then most of the sampling points should be consistent with some delays only when the EC/SMART sensors are sampled.
 
The drivers are mostly the same.... GPU driver is the same every time. Chipset/ME is the same as well. LAN is from Windows, but could be killer instead of Intel... audio is Realtek-based (i don't install anything else). The difference between boards isn't much at all on that front (though different controllers, etc, indeed). I'll keep an eye out on the timing between them moving forward.

Thank you again for your support! :)
 
Back
Top