Hello all,
I was thinking of buying a cooler since my laptop was getting heated up when playing games these days. I'm also planning to change the thermal paste, but before doing so, I was doing a stress test using prime95 "Small FFTs (tests L1/L2/L3 caches, maximum power/heat/CPU stress)" configuration on 3 scenarios -
1. flat on desk
2. using stand
3. using cooler
Both cooler and stand use a suitable elevation.
I noticed that the Core Clock speeds dropped from about 4.5GHz to 1.5GHz in the stress test, which is absurd. Thus, I also have recorded without doing a stress test. Each record is a 5-minute stress (+nostress) test record.
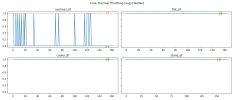
Below are some plots for the 4 scenarios. What do you infer from these?
The title of the plots mentions which stat is plotted, and the individual titles of the 4 subplots mention the scenarios. Max and min (of samples discarding some initial data points) are shown in red and green dashed lines with values.
Stats plot attached -
1. Average Effective Clock [MHz]
2. Core Clocks (avg) [MHz]
3. Core Temperatures (avg) [°C]
4. CPU Package Power [W]
5. Core Usage (avg) [%]
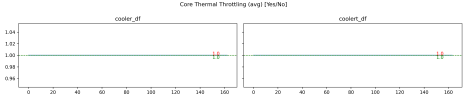
6. Core Thermal Throttling (avg) [Yes/No]
If any more plots or CSV log files are needed, I can attach them.
My analysis:
Looking at the "Core Temperatures (avg) [°C]", it seems the stand works best, whereas the "Core Clocks (avg) [MHz]" or the "Average Effective Clock [MHz]" says the flat is the best??
Thermal throttling occurred at some of the cores all the time (3 out of 8 cores), which should mean better cooling = better clock speed, but that is not the case??
Also, the "Core Thermal Throttling (avg) [Yes/No]" says that even without a stress test, there is sometimes throttling occurring, which means I have to change the thermal paste and clean the laptop (the laptop is 1-2yr old). I'll follow up with the same tests after that is done.
But the question persists, why has the clock speed decreased from 4.5GHz to 1.5GHz, as can be seen in "Core Clocks (avg) [MHz]"!!
I was thinking of buying a cooler since my laptop was getting heated up when playing games these days. I'm also planning to change the thermal paste, but before doing so, I was doing a stress test using prime95 "Small FFTs (tests L1/L2/L3 caches, maximum power/heat/CPU stress)" configuration on 3 scenarios -
1. flat on desk
2. using stand
3. using cooler
Both cooler and stand use a suitable elevation.
I noticed that the Core Clock speeds dropped from about 4.5GHz to 1.5GHz in the stress test, which is absurd. Thus, I also have recorded without doing a stress test. Each record is a 5-minute stress (+nostress) test record.
Below are some plots for the 4 scenarios. What do you infer from these?
The title of the plots mentions which stat is plotted, and the individual titles of the 4 subplots mention the scenarios. Max and min (of samples discarding some initial data points) are shown in red and green dashed lines with values.
Stats plot attached -
1. Average Effective Clock [MHz]
2. Core Clocks (avg) [MHz]
3. Core Temperatures (avg) [°C]
4. CPU Package Power [W]
5. Core Usage (avg) [%]
6. Core Thermal Throttling (avg) [Yes/No]
If any more plots or CSV log files are needed, I can attach them.
My analysis:
Looking at the "Core Temperatures (avg) [°C]", it seems the stand works best, whereas the "Core Clocks (avg) [MHz]" or the "Average Effective Clock [MHz]" says the flat is the best??
Thermal throttling occurred at some of the cores all the time (3 out of 8 cores), which should mean better cooling = better clock speed, but that is not the case??
Also, the "Core Thermal Throttling (avg) [Yes/No]" says that even without a stress test, there is sometimes throttling occurring, which means I have to change the thermal paste and clean the laptop (the laptop is 1-2yr old). I'll follow up with the same tests after that is done.
But the question persists, why has the clock speed decreased from 4.5GHz to 1.5GHz, as can be seen in "Core Clocks (avg) [MHz]"!!
![Average Effective Clock [MHz].png](/forum/data/attachments/10/10487-f55b5084b947df6659751d10a14d554f.jpg?hash=9VtQhLlH32)
![Core Clocks (avg) [MHz].png](/forum/data/attachments/10/10488-58f4e3ff2eb7f8c9775aa3905923c865.jpg?hash=WPTj_y63-M)
![Core Temperatures (avg) [°C].png](/forum/data/attachments/10/10489-24a3800b1bac4ec30d7624b1addfd26b.jpg?hash=JKOACxusTs)
![CPU Package Power [W].png](/forum/data/attachments/10/10490-2df364f2dadd00cc3f5e96db2d830095.jpg?hash=LfNk8trdAM)
![Core Usage (avg) [%].png](/forum/data/attachments/10/10491-6872c904d3821190c35f77668dab1120.jpg?hash=aHLJBNOCEZ)
![CPU Package Power [W].png](/forum/data/attachments/10/10529-4870ac164f0aa22d585a46a4e912be5d.jpg?hash=SHCsFk8Koi)
![Core Usage (avg) [%].png](/forum/data/attachments/10/10528-bc09393ec4da1df9c2b303d7b70bb377.jpg?hash=vAk5PsTaHf)
![Core Temperatures (avg) [°C].png](/forum/data/attachments/10/10526-05b03ef6b275fc3262324e10f109d5c4.jpg?hash=BbA-9rJ1_D)
![Core Clocks (avg) [MHz].png](/forum/data/attachments/10/10525-64237d1a286ca6fb64f1128690a04572.jpg?hash=ZCN9Gihspv)
![Average Effective Clock [MHz].png](/forum/data/attachments/10/10524-91ee3d73f5a4bc55642e4d014d5734f0.jpg?hash=ke49c_WkvF)
![Average Effective Clock [MHz].png](/forum/data/attachments/10/10530-5dced34a931d48b37e6042b0f16f06fc.jpg?hash=Xc7TSpMdSL)
![Core Clocks (avg) [MHz].png](/forum/data/attachments/10/10531-4720bb20a247c9ee4d8ba2df0be8e736.jpg?hash=RyC7IKJHye)
![Core Temperatures (avg) [°C].png](/forum/data/attachments/10/10532-1e3efe27a569d4add70a272358ce00ac.jpg?hash=Hj7-J6Vp1K)
![Core Usage (avg) [%].png](/forum/data/attachments/10/10534-0a63401b9882b980821f276ac4cceece.jpg?hash=CmNAG5iCuY)
![CPU Package Power [W].png](/forum/data/attachments/10/10535-75ff7ff8ef1a29e0487f8a9f51fd7603.jpg?hash=df9_-O8aKe)