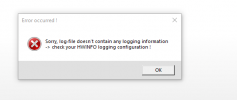
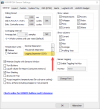
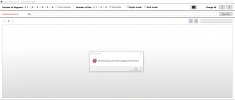
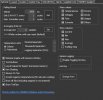
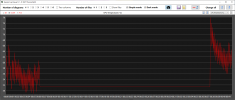
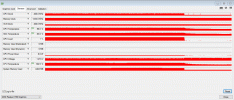
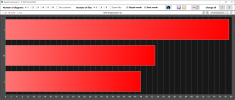
LogViewer for HWINFO is available !

what a cracking piece of software Tom, so much easier than opening in excel and creating graphs :)

Suggestions for a next version though

1) a "super" simple view that also hides this section
1621230878166.png
2) Ability to customise line & background colours (if this can be done by editing the config xml then that too me at least would be good)
3) Ability to adjust font size on graphs(see comment above regarding config xml)
 
Hi WinstonWoof,

I am just finishing the upcoming release 6.0 :oops:
Maybe I will integrate "some configs" in one of the next relases ...

Regards
Tom
 
Cheers Tom,

speaking for myself even if it was a "manual" thing that could be done via the XML file rather than a GUI option that would be more than acceptable (and possibly less work for you??) :)
 
Hello WinstonWoof,

yes, if this feature should come, then it will surely be solved via a config file. But even there is some work to do with my quality requirements. An error handling has to be implemented, which usually needs more code than the actual function. Additionally some unit tests have to be written (currently Generic Log Viewer is checked with 320 unit tests). Furthermore, I believe that only a very small part of users (< 10 percent) use this feature at all.

Regards
Tom
 
Hi all,

"problem" of @angarato_surion is identified, he changed the "Logging Separator (CSV)" to Semikolon ";"
Must be default value Comma "," otherwise Generic Log Viewer can't read the data (setting the logging separator is not possible in Generic Log Viewer).

Separator.png

Regards
Tom
 
Hi Tom,
i got the the error message with no guilty DateTime too.
The settings in HWinfo might be correct (in refer to other posts). i dont know whats the problem...

Maybe you can help to analyze my logfile!?
I will explain the problem on my pc as follows:

My pc goes sporadic shut-off during playing games. Its like a disconnect of power cable.
If the pc runs in idle (just in windows) this problem wil not occour.
So the last 1 minute of the logfile is very important to see what happened.

I guess maybe the 12V is dropping when the error occours.

Attached you will find the logfile. Please rename it from .txt to .csv (csv extension is not allowed to upload)
Thanks in advance =)
 

Attachments

  • Screenshot 2021-06-18 190755.jpg
    Screenshot 2021-06-18 190755.jpg
    92.3 KB · Views: 7
  • Screenshot 2021-06-18 192526.jpg
    Screenshot 2021-06-18 192526.jpg
    68 KB · Views: 6
  • fail.CSV.txt.7z
    fail.CSV.txt.7z
    364.7 KB · Views: 0
Hi ztmgamning,

strange, the last line of your logfile contains 523'450 (!) Spaces or something else, I removed this line -> now it's fine !
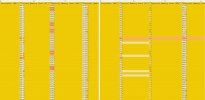
But the values seem not to match with the columns definitions. If you open logfile in Excel, you can find e.g. a "Physical Memory Load" >10'000 %

Values.png

Important:
if you change the configuration "which sensors should be logged", you must do a "complete restart of HWINFO", otherwise you can get a column-value-mismatch like shown above !
HWINFO seems to have a problem there ...

Regards
Tom
 

Attachments

Last edited:
@TomWoB FYI - HWiNFO will introduce new options to use RFC 3339 or ISO 8601 date formats for sensor logs. You will probably need to adjust for this.
 
Hi Tom,
thanks for your fast answer.

I have checked your information and believe i have found the main problem.

strange, the last line of your logfile contains 523'450 (!) Spaces or something else.....
Under normal conditions, start logging and stop logging by cklick on the button, the CSV file contains the first and the last line similar entrys (the columns definitions).

In my case, HWinfo cannot finish writing the file because my pc simply switches itself off. Thus the last line in my log file is empty and the column definitions are missing.
I opened the log file in WinMerge and this shows the last line as you can see in the attached screenshot "last_line".

But the values seem not to match with the columns definitions. If you open logfile in Excel, you can find e.g. a "Physical Memory Load" >10'000 %
The missmatch of column definitions with the values looks like an interpreter issue or creation of logfile issue.

I created a new logfile with HWinfo with the same separator settings like my last screenshot but this time i started and stopped the record by myself (no switches off by itself) and i found there is the same missmatch of the columns.
This means the missmatch has nothing to do with the missing column definitions in the last line.

I guess the main issue is the decimal separator setting.
I changed the decimal separator setting to "-" and now the values matches with the columns definitions. Take a look to the screenshot "compare".
Sure, is a little bit difficult to read, but its the only way to match the columns =)

This means that when the log file is written, a new column is used after each comma. As a result, your logviewer will interpret this in exactly the same way.


I hope to help you to improve your programs.
I also attach the original files, so that you can perhaps analyze it better.

I definitely know how I can display the log file without a viewer in order to track my problem with the pc. A diagram representation is certainly better, but unfortunately not possible at the moment.

Thanks a lot.
If you have some questions about this you can send me a PM =)
 

Attachments

Hi ztmgamning,

yes, you are right, but your problem is very simple: you can't use the same character "," (comma) as
  1. column separator AND
  2. decimal separator
That's the case in your "sep_comma.csv" file. I think the default setting of these two parameters depends on the "Windows Language Settings", there is an own part for "Numbers Format" (which is typically country specific).

OK, you should do the following:
  1. the column separator is given = comma (the logfile-type is CSV = Comma Separated Value)
  2. use a DOT/POINT as decimal separator
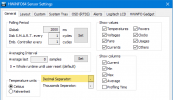
Settings.png

The "Thousands Separator" has no impact on my PC, I tried ' (high comma) and default , (comma, which should not used) -> no impact = not used.
Numbers > 1000 are logged without any "Thousands Separator", e.g.: 13965

Again: I think with dot/point as "Decimal Separator" it should be fine ...

Regards
Tom
 
New Version 6.1

Hi all, I built a version 6.1 with the following new features:
  • Style your own Generic Log Viewer MainWindow ... if you like
  • Diagrams can now be "locked" (for "Change all" buttons with SMART-functionality)
  • Some new "Hot-Keys" are implemented
  • Compatibility with HWINFO Date/Time Formats RFC 3339 and ISO 8601

Styling MainWindow
You can set some parameters with a "Style-File" to define your own look of your Generic Log Viewer. As an example, have a look at the color settings of beta-tester @WinstonWoof

look.png

For details please check the attached example style-file "UserStyleExample.sty" ...
Remark: I do not recommend such colors/settings as in "UserStyleExample.sty", but showing the effect of any parameter is easier with "strange colors" :cool:


Locking Diagrams
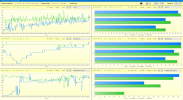
If you use the "Change all" SMART functionality to get an overview of all log categories (YouTube), here is a new feature for you. It surely happens "while browsing" through all log-categories, that you want to "keep" a chart to compare it with other, upcoming categories. This is now possible, you can right-click on a diagram to "lock" it. I.e. it does not change anymore with "Change all" until it is "unlocked" again (another right-click):

locked.png
Tip: if you additionally press the new hot-key "S" (Sort) after you have locked a diagram, all "locked" diagrams will be moved to the "top rows" of the Generic Log Viewer. So you can fill up the Generic Log Viewer bit by bit with the interesting diagrams "from top to bottom" ...


New Hot-Keys
Pressing "F1" (Help) opens a window with the currently supported hot-keys. Especially interesting could be hot-key "H" (Header): the header line of the Generic Log Viewer can be hidden, so that more space is available for the diagrams.


Special thanks to @WinstonWoof for beta testing ;)

Hope you enjoy the new features
Tom
 

Attachments

Last edited:
Hi Tom.
The log viewer is great tool. I am often, using it to analyze recorded hwinfo data.
Since the last update with the hot-keys, I noticed may be a bug or misbehavior.
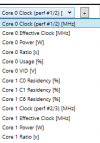
I have expanded the sensor box and I know directly what I need and I want to type "Core 0 ...", but instead save screenshot dialog is opened.
C - is taking priority for take screenshot instead for matching in the box.

1626548178088.png
 
Last edited:
Hi edhunter,

you are absolutely right. I didn't think of that at all, because I never use the "Search in ComboBox" feature. Btw: it's not a bug, it's a feature ;). The program does what it was programmed to do. But you can type "Shift+C" (capital letter C), this still works. The "problem" will unfortunately also occur with the other new single hot-key letters.

Another solution can be, that you configure once your Generic Log Viewer setup manually and then save this setup in a config-file. After that, you configure a shortcut on the desktop with this config-file as a command-line-argument (YouTube Demo). If you drag&drop a log-file on this shortcut, Generic Log Viewer starts and loads the log-file and your setup automatically.

Regards
Tom
 
Hi TomWoB,

I just recently found out about GenericLogViewer and what an awesome tool it is. Thank you so much for working on it and making it better. Earlier today, I was doing a stress test of my Asus PN50 and recording sensor logs from GPU-Z (v2.40.0). After the test, I load the log file in GenericLogViewer (v6.1) and noticed that the CPU temperatures weren't being plotted correctly (attached image)

GLV_Blank-CPU-Temps.png

Readout from GPU-Z during the test:
gpuz-complete-2.gif

As you can see, GPU-Z recorded the CPU temp reaching a maximum of 102.5 degrees Celsius and I can confirm that I can find it in the sensor log but GenericLogViewer couldn't find it and I got this graph when I used the 'Triple' mode to get the min/max/avg temps
GLV_triple.png

I'm not sure if maybe I'm not using it correctly or maybe the log file from GPU-Z is corrupt or something else. I've attached the sensor log from GPU-Z as well. Could you help me understand what might be wrong here?

Thanks again for this awesome tool.
 

Attachments

Back
Top