Ryzen 7-5800X3D - Current Clock Speeds never drop below Base speed at idle

CJB

New Member
Hi, if this has been discussed already I apologize.
I prefer using HWInfo for monitoring my hardware and always worked well on all my Intel machines.

I have noticed that the current clock speeds never fall below base speed on the processor.
In Ryzen Master it shows the cores are sleeping.

I'm a bit OCD so to date I have reloaded / factory reset my machine and only loaded my B550 chipset drivers.
I then did a flash back to AGESA 1.2.0.6B and then upgraded to AGESA 1.2.0.7 but the same behaviour.

I have seen a comment on reddit saying that Ryzen puts cores to sleep and so you only see the last value it outputted - Is this correct?

Please help me regain my sanity :) Take care
 
You will need to watch the Effective Clocks in HWiNFO as this is a much better indicator of the low power states as described here: https://www.hwinfo.com/forum/threads/effective-clock-vs-instant-discrete-clock.5958/
These clocks are based on a differential method so they report the average clock measured across the polling interval. Ryzen Master seems to be reporting a core sleeping when its effective clock drops below a certain margin. Not sure what exact this margin is, could be a few dozens on MHz.
 
Hi, if this has been discussed already I apologize.
I prefer using HWInfo for monitoring my hardware and always worked well on all my Intel machines.

I have noticed that the current clock speeds never fall below base speed on the processor.
In Ryzen Master it shows the cores are sleeping.

I'm a bit OCD so to date I have reloaded / factory reset my machine and only loaded my B550 chipset drivers.
I then did a flash back to AGESA 1.2.0.6B and then upgraded to AGESA 1.2.0.7 but the same behaviour.

I have seen a comment on reddit saying that Ryzen puts cores to sleep and so you only see the last value it outputted - Is this correct?

Please help me regain my sanity :) Take care
As the thread about instant-discrete clock vs effective clock explains, what you see in Current/Min/Max/Avg Core Clock is the speed only when the cores are active (C0 state)
Effective clock contains C0 and other C-states also like C1/C6 (Halted/PowerDown). On Eff-Clock you can see really low numbers close to 0 (zero) or even 0 on some cores (Minimum value)

Now the lowest non-Effective clock, the one you see at base speed, depends on windows settings.
If you use some high performance power plan the speeds should be around 3.6~3.8GHz
When using a balanced plan this speed goes closer to 3GHz, around 3.2-3.3GHz
On a power saving plan the speed drops way below 3GHz down to 2.2-2.5GHz

So on this 3 different power plan settings you are seeing the minimum (considered as active) speed before the cores enter a sleep/deep sleep state (C1 and C6)

On "C-State Residency" section of HWiNFO sensors if you expand the menus you will see each core on its 3 main states...
C0: active
C1: sleep (or halted)
C6: deep sleep (or power down)

...and how much (%) of time they spend(resident) in each state.
Some cores you'll see are more active than others and vice versa.
Depends on your CPPC configuration of your CPU. The CPPC order can be seen on core clocks (perf #x/x) order numbers.
 
Follow up question along these same lines.
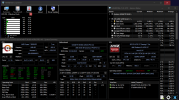
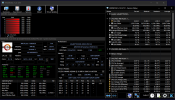
I notice on the "Active clock" mini window. The bars are all red.
If I recall red indicates the current clock is above specification.
However, if I click on the "Active Clock" mini window, you can switch to "Effective Clock"
Do I have something set wrong for my 5800X3D?
Or is this normal behavior.
I apologize if this is discussed elsewhere, I failed at googling the correct terminology to get the answers.
Thanks anyone who has insight.

Active Clock.PNGEffective Clock.PNG
 
Hey there,
Thanks again for the help Martin. Seeing the same behavior after installing the latest version of HWiNFO and updating to the latest BIOS on the mainboard.
Attached screenshots for reference and ZIP file with debug file and report as indicated.
If this is supposed to be reported as a bug, I can submit a bug report if needed.
 

Attachments

  • Capture1.JPG
    Capture1.JPG
    156.7 KB · Views: 9
  • Capture2.JPG
    Capture2.JPG
    156.3 KB · Views: 9
  • debud file & report.zip
    debud file & report.zip
    734.7 KB · Views: 2
Thanks. This actually isn't a bug. The clock is shown in red (which is just a color representation not meaning a problem) because it runs above the standard Turbo limit yet still below the PBO limit which is 4550 MHz.
 
Back
Top