Hi,
I tried searching for this error but.. the forum seems to discard short search terms, so i'm out of luck with "SPD" and "hub" lol
My rig is using Aquasuite (with all its hardware monitoring disabled) and HWinfo for sensor polling to aquasuite.
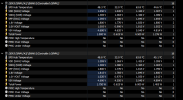
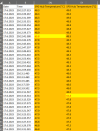
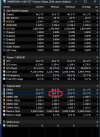
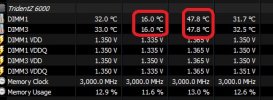
I noticed that on both ram sticks at the end of the day i have a maximum temperature reached of 63.8°C exactly which is very odd.
The hottest i could get them while playing games like hogwarts legacy was 49 - 50 °C tops.
I only once saw the spike happen live. i opened Steam, and the RAM temperature did 43°C - 63.8°C - 43°C in 3 consecutive readings.
I was wondering if that was a known issue, or if anyone had any idea what may cause it.
I know it hapens everyday, but it seems to happen at random, and pretty rarely.
I don't have any other monitoring software apart from HWinfo. I actually reinstalled Windows 11 last weekend, so it's still a very clean install.
I was seeing the Hyper-V warning message on HWinfo main window so i wondered if that would cause a problem, but there is no way to make it go away except by disabling virtualization in the Bios. Hyper-V has never been installed on my PC. I tried installing/uninstalling it see if it would refresh but no.. still getting the virtualization warning. Anyway, i have virtualization totally disabled and the weird readings keep happening.


