HWiNFOMonitor 2.0

stangowner

Moderator
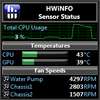
HWiNFOMonitor is an advanced Sidebar Gadget which allows to display and monitor any HWiNFO sensor data.
It's fully customizable and can display values in text, graphs or bars. SideShow is supported as well.

HWiNFOMonitor100x100.png


Download HERE

Version 2.0 Release Notes
- Reconfigured monitor ID to be compatible with recent changes in HWiNFO. You must be running HWiNFO beta v4.47-2333 or higher.
- Changed refresh rate setting from seconds to milliseconds (Please Note: The sidebar.exe process will use high CPU if set too low. HWiNFO's scan interval must not be higher than the gadget's for values to update every gadget refresh.)
- Added right click option to Display Filter arrows allowing you to reorder a sensor to the top/bottom of the list. Left clicking the arrow will still move it one position only.

Please Note: Global settings (color, title, main icon, etc) will be maintained during upgrade from 1.1 to 2.0. However, due to the changes in the sensor tracking IDs, all sensor specific customizations will be lost and need to be reconfigured. If you see any abnormal behavior (duplicate sensor list in display filter and sensor drop down list, please close the gadget and delete the "C:\Users\<username>\AppData\Local\HWiNFOMonitor\prefMonitors_#.json" files.
 
One thing I noticed with the combination of Gadget V2.0 and HWInfo32 Beta 4.47-2333 is the following. After making changes, like disabling some sensors ind the gadget setting or renaming the sensor in the gadget, then saving and leaving the settings window. While it saves the changes the Windows 7 mouse cursor shows the loading circle for 2-3 seconds. I didn't notice that before.

As for: "HWiNFO's scan interval must not be higher than the gadget's for values to update every gadget refresh."
Does that mean, if my sidebar gadget has an interval of 3000ms, should I enter slower (higher miliseconds) values in the HWinfo32 setting for the monitoring? Like 4000ms? Currently I have 3000ms in the sidebar and 2000ms in the settings of the hwinfo32 sensor page.
 
nuggibert said:
One thing I noticed with the combination of Gadget V2.0 and HWInfo32 Beta 4.47-2333 is the following. After making changes, like disabling some sensors ind the gadget setting or renaming the sensor in the gadget, then saving and leaving the settings window. While it saves the changes the Windows 7 mouse cursor shows the loading circle for 2-3 seconds. I didn't notice that before.
This happens because the gadget "helper" is restarted now after configuration changes to properly reflect refresh timing changes. Previously it was fixed at 1 second, so it would query HWiNFO for updates every second, even if your gadget refresh was 3. Now it will only query HWiNFO every 3 seconds saving a few CPU cycles. ;) The helper is lightweight, but every bit counts. And it now allows sub one second updates which it did not before.
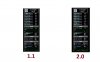
nuggibert said:
As for: "HWiNFO's scan interval must not be higher than the gadget's for values to update every gadget refresh."
Does that mean, if my sidebar gadget has an interval of 3000ms, should I enter slower (higher miliseconds) values in the HWinfo32 setting for the monitoring? Like 4000ms? Currently I have 3000ms in the sidebar and 2000ms in the settings of the hwinfo32 sensor page.
HWiNFO defaults to every 2000ms. So if you set the gadget to say 500ms, the gadget will refresh every 500ms but the values will only change every 2 seconds when HWiNFO updates them. So in this case, you'd have to set HWiNFO to 500ms too, and then the gadget will show changes every half a second. If the gadget is set to 3000, then set HWiNFO to 3000 to save some clock cycles in that program too, unless you actually intend for HWiNFO to update more frequently than the gadget.
 
If you would create optional files to increase the size of the gadget at some point (like here: http://www.hwinfo.com/forum/Thread-Increasing-size-of-gadget), I'd really appreciate it.

I tried modifying the new files like the ones in the old xlarge.zip in notepad++, but it didn't work (I probably screwed it up). Also the DPI scaling tweak (from here: http://www.hwinfo.com/forum/Thread-Custom-dpi) doesn't seem to work anymore; it only shows minimum values, and will not display the maximum.

PS: The right-click sorting is great. Re-ordering is going much quicker than before.
 
I'm on my way to India right now for work. It will be a few weeks before I can work on this. Thanks for the feedback.
 
I'm seeing an issue with Physical memory available being maxed out at 9999MB in the gadget display, but when the flyout expands, it shows correctly there. Once my memory available drops below 9999, it starts to show correctly. I have 16GB of RAM, but may soon upgrade to 32GB so was wondering if 9999MB is indeed a hard max for that line?

I added a screenshot of what I am seeing.
 

Attachments

  • Clipboard01.jpg
    Clipboard01.jpg
    59 KB · Views: 112
kellewic said:
I'm seeing an issue with Physical memory available being maxed out at 9999MB in the gadget display, but when the flyout expands, it shows correctly there. Once my memory available drops below 9999, it starts to show correctly. I have 16GB of RAM, but may soon upgrade to 32GB so was wondering if 9999MB is indeed a hard max for that line?

I added a screenshot of what I am seeing.

Yes, the gadget does not have much space, and therefore is limited to 4 digits. Please read this post to change to GB.
 
stangowner said:
kellewic said:
I'm seeing an issue with Physical memory available being maxed out at 9999MB in the gadget display, but when the flyout expands, it shows correctly there. Once my memory available drops below 9999, it starts to show correctly. I have 16GB of RAM, but may soon upgrade to 32GB so was wondering if 9999MB is indeed a hard max for that line?

I added a screenshot of what I am seeing.

Yes, the gadget does not have much space, and therefore is limited to 4 digits. Please read this post to change to GB.

Ah, got it. Thanks!
 
Hi,
i downloaded the gadget file (HWiNFOMonitor.gadget) but don't understand how to turn it on.....i saved the file in HWinfo directory

Thanks
 
On 1.1, while having each CPU thread displayed Med Image/Bar, is bar empty when thread load is 0%, but on 2.0 there is a bit of bar in green even if thread load is 0%. What can i do, to make it empty again at 0% usage?

I am attaching a screenshot, so you know what i mean. I am talking about that eight Cores bars from top.
 

Attachments

  • Bez názvsau.jpg
    Bez názvsau.jpg
    77.1 KB · Views: 61
Can you zip the "C\Users\username\AppData\Local\HWiNFOMonitor" folder and "C\Users\username\AppData\Local\temp\HWiNFOMonitor.log" file and email it to the address listed in the gadget?  Thanks.
 
stangowner said:
Can you zip the "C\Users\username\AppData\Local\HWiNFOMonitor" folder and "C\Users\username\AppData\Local\temp\HWiNFOMonitor.log" file and email it to the address listed in the gadget?  Thanks.


Sent it. But only HWiNFOMonitor folder. There is nothing in concerning HWiNFO in TEMP folder..
 
How to make 2 digital places in HWiNFOMonitor 2.0 for temperature values? I was able to make it for % values by adding to line 180 of shared.js units == "%" . And it worked. But it doesn't work for °C if i add units == "°C" .
 
The units are converted to lower case before the comparison, so change
units == "°C"
to
units == "°c"
and it should work fine.
 
With the newest (5.22 and possibly 5.20) version if I disable the "Average" column in HWINFO the gadget does not show the units.
 
Hi there!

I have a smaller issue with this great gadget.
I attached a screenshot. It seems that the Diagramms are cropped / cutted from the sensor below.

In this thread somebody compared V1.1 with V2.0 and I see on this screenshot that this issue comes with V2.0

Do I missconfigurated the Gadget or is this a general problem?

Thanks for reply in advance

- Alex
 

Attachments

  • gadget.jpg
    gadget.jpg
    265.1 KB · Views: 79
Hi,

I don't think Rebkos was referring to a similar issue.  That post looks to me like the 1.1 version was only running for 10 seconds, while the 2.0 version was running longer.  You can see that all graphs have no value when the gadget is first loaded as there is no historical data.  The graph slowly starts pushing left as it runs for a bit.  Once a full cycle has passed, it never has no line for a 0.

The only issue I see in both is that the upper and lower bound numbers on the left are positioned a bit too far down, causing the lower number to get clipped.  Otherwise, it seems fine.

I think you can correct this alignment by doing the following:
1) close gadget
2) open "C:\Users\<username>\AppData\Local\Microsoft\Windows Sidebar\Gadgets\HWiNFOMonitor.gadget\scripts\shared.js" with a text editor
3) Change the top margin value in line 590 to be a bit greater (smaller as its negative).  For example, this change should pull those 2 bounds up 6 pixels
dhtml += '<div style="margin-top=-32px;margin-left:2px;">';
to
dhtml += '<div style="margin-top=-26px;margin-left:2px;">';
(or make the 16px smaller in line 593 to only pull up the lower one, leaving the top one where it is).
4) save the shared.js file
5) open gadget and check for alignment.  Tweak a few more pixels as needed.

This code did not change from 1.1 to 2.0, so I'm not sure where the alignment issue is coming from offhand.
 
Back
Top