I would like to consult on possible causes of the phenomenon

VictorVG

Well-Known Member
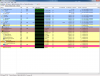
For quite a long time (probably since the beginning of the year) was observed strange phenomena in my opinion - periodically obyno network activity after the OS or applications increases dramatically the use of CPU core and this effect is accompanied by a similar to HWiNFO32 / HWiNFO64, but only on the same machine. At first I thought that it is caused by the consequences of errors of drivers NIC, but after replacing the HDD you install the OS from the installation DVD phenomenon is preserved while it is accompanied by a second phenomenon - after their restart HWiNFO32 / HWiNFO64 stops reading SPD and the information displayed on the screen System Summary in RAM block, we see an empty space such as the machine is not installed memory modules, and this phenomenon can (on this machine is not always) accompanied by a failure X-s leading to their restart. I personally assume that there is any conflict of RAM modules, or simply banal refusal chipset, although such an instrument malfunction, and is not, and even at a time oscilloscope and waveform analyzer show that the equipment operates with no visible errors and tolerances specifications nodes.

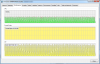
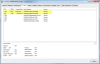
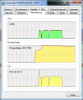
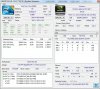
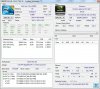
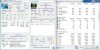
Please, see attachment screen shot (left to right) for illustration on this phenomenon: screen 1 - Process Hacker display CPU time using in %% and history on latest 60 sec, screen 2 - HWiNFO64 before restart this phenomenon is exists, screen 3 -  HWiNFO64 after restart this phenomenon is exists.

Hardware config is:


CPU:           Intel Core 2 Duo E8500 (Wolfdale-H, E0)
               3166 MHz (9.50x333.3) @ 1997 MHz (6.00x333.0)
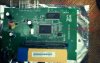
Motherboard:   ASUS P5Q SE
Chipset:       Intel P45 (Eaglelake-P) + ICH10 Consumer
Memory:        4096 MBytes @ 399 MHz, 6.0-6-6-18
               - 2048 MB PC6400 DDR2-SDRAM - Samsung M378T2863RZS-CF7
               - 2048 MB PC6400 DDR2-SDRAM - Nanya Technology M2Y2G64TU8HG5B-AC
Graphics:      NVIDIA GeForce GTX 550 Ti, 1024 MB GDDR5 SDRAM
Drive:         WDC WD1002FBYS-02A6B0, 976.8 GB, Serial ATA 3Gb/s
Drive:         ST3160023AS, 156.3 GB, Serial ATA 1.5Gb/s
Drive:         ST3160811AS, 156.3 GB, Serial ATA 1.5Gb/s
Drive:         PIONEER DVD-RW  DVR-112, DVD+R DL
Sound:         Intel ICH10 - High Definition Audio Controller [A0]
Sound:         NVIDIA GF116 - High Definition Audio Controller
Network:       Qualcomm/Atheros AR8121/AR8113/AR8114 PCI-E Ethernet Controller (L1e)

P.S.

The phenomenon is clearly not so common that we can make a similar hypothesis about its nature and, therefore, of interest to me. But since I can not afford to respond to what we have to do is put this topic off-topic to when we define the character of its nature to take the right decision where to move? I will try to replace the allegedly incompatible equipment, but the question is will selecting his replacement or the market has no analogues thereof (at least within "drive, choose and buy")?
 

Attachments

  • ph.jpg
    ph.jpg
    59.6 KB · Views: 1
  • HWiNFO64_norestart.jpg
    HWiNFO64_norestart.jpg
    100.7 KB · Views: 1
  • HWiNFO64_restart.jpg
    HWiNFO64_restart.jpg
    96.5 KB · Views: 1
  • HWiNFO64LOG.TXT
    116.2 KB · Views: 1
Added - time Sun Nov 22 17:31:47 +0300 2015 this phenomenon already started on time +20 min after restart OS, no application activity, HWiNFO64 restarted in to debug mode. In attachment HWiNFO64 screen shot and debug log. I don't have on any idea... :(
 

Attachments

  • debug.jpg
    debug.jpg
    167.5 KB · Views: 1
  • HWiNFO64.DBG.7z
    43.2 KB · Views: 0
I believe the first problem (higher CPU load) during sensor readout is caused by some of the sensors. Please try to disable sensors one by one until you find the one which after disabling reduces the CPU load.
As for the second issue (SPD missing) - when does it work? When you boot the machine does it show the SPD values only for the first time when you run HWiNFO and all subsequent starts of HWiNFO won't show SPD until rebooted again ? Is that a correct understanding ? Also, attaching the HWiNFO Debug File might tell me more. OK, I see you just attached the DBG file.
 
Sensors seems to me there is not influenced - I suspect the incompatibility of memory - the first Nanya M2Y2G64TU8HG5B-AC sold included 2 x 2 GB under the brand Silicon Power, the second bar was on chips Silicon Power, and it had problems (hang chipset), ASUS P5QL / EPU (P43 + ICH10) and her silence was replaced on warranty Samsung M378T2863RZS-CF7 (still found at her datashit :)) on the machine set as forced on another machine network with this memory not run a bunch P5QL / EPU and Core 2 Duo E7300 / E8500 as after changing the CPU chip set the frequency of the RAM 1067 and 1112 MHz depending on the CPU which greatly exceeds the capacity of the operating frequency of these modules and there had to put Kingston KVR800D2N6/ G which to my surprise, even with errors reading the matrix, but started up at a frequency of 1112 MHz with 1,8V and allowed to set a fixed frequency of 800 MHz RAM. Sensors check, but I unloaded HWiNFO64 HWiNFO32 driver to stop by means of Process Hacker (using Native API) and SCM console CPU utilization did not change that seems to me more like the incompatibility of modules.

Screen shots - CPU usage on the left after the occurrence of the phenomenon. The program HWiNFO64 unloaded and the driver HWiNFO32 stopped, on the right - the OS is restarted, for easy observation insignificant part of the process tree is minimized.
 

Attachments

  • M378T2863RZS-CF7 Datasheet.pdf
    6.5 KB · Views: 0
  • HWiNFO64_stop.png
    HWiNFO64_stop.png
    34 KB · Views: 3
  • summary.png
    summary.png
    66.1 KB · Views: 3
  • HWiNFO64_OS_started.DBG.7z
    40.5 KB · Views: 0
  • HWiNFO64_restarted.DBG.7z
    31.9 KB · Views: 0
Added: time = + 03:00:00

Network activity OS - no, application - no, system using status iddle:

Screen shots and listing's:

perfomance.png - CPU using, RAM using (Private bytes == Working set (Microsoft) - is code RAM used);


statistics.png - HWiNFO64 task statistics;

stack.png - threads stack, all lists;

stack.txt - steck list by threads
 

Attachments

  • perfomance.png
    perfomance.png
    37.4 KB · Views: 2
  • statistics.png
    statistics.png
    40.2 KB · Views: 2
  • stack.png
    stack.png
    44.6 KB · Views: 2
  • stack.txt
    3.2 KB · Views: 1
So the high CPU load happens also when you don't have sensors open? What's active then, only the system summary window ?
 
HWiNFO64 settings reset by default:
 

Attachments

  • HWiNFO64.png
    HWiNFO64.png
    30.1 KB · Views: 2
  • PH.png
    PH.png
    121.1 KB · Views: 2
Yes, overwriting HWiNFO64.INI option from a Zip file version 5.10, has disabled the unused board sensors, re-adjust the program and it seemed at first glance, the situation has stabilized. At least surges CPU kernel is not observed for HWiNFO64 Process Hacker shows CPU usage by 0.39% to 1.58%. It looks like an old copy of the config was erroneous entries are likely to appear during faults Comodo Firewall 8.0 (he accumulated error in the configuration as the machine is used as a test bench), and in the end, I pushed myself to the erroneous hypothesis that the cause of failure in the network and was looking for in the wrong direction, although there were problems caused by the overflow of their RAM router TP-LINK TL-460 at speeds above 20 Mb / s.

This router at all "miracle of technology" - SoC Realtek RTL8196C + 8 MB SDRAM (ESMT M12L64164A-7T) + 8 Mb EEPROM, the router is running a makeshift assembly Linux. :) The OS boot uses almost the entire volume available in the device RAM - 7,8 Mb, so that routing tables, DNS, DHCP, and built-in anti-virus remains around 200 KB. Well, the "brilliant solution" visible to users in the form of hang-ups in the "big" speeds. For 10 - 15 Mbps its possibilities are almost at the limit, at 20 - 25 Mbps if the parallel runs for example two - three client host, the HTTP Error 504 is displayed again in a few hours, at a speed of more than 30 Mbps throughput for memory overflow router is simple enough send mail, and if it is sent to any file regardless of its size the device hangs within 5 - 15 minutes and the user will be able to greatly lucky if by HTTP administrative console cause and restart the router. In 9 cases out of 10 have to turn off the power. But this thing is cheap - I bought it it was worth "as much as" $23 USD. :)

I did not have time to look for something class 3COM or MikroTik - it was necessary to urgently connect the channel, and the whole party of D-Link DIR-300 (about two thousand units) was defective - in 15 - 20 minutes of lost device settings. After the D-LINK for a long time apologized for the marriage, but in the procurement documents and labeling in the buildings standing "Made in USA". :) Ever since I prefer it not to work with iron. Better to pay three times for 3COM, HP, SMC, MicroTik but sleep. :)
 

Attachments

  • TP-Link_TL-R460.jpg
    TP-Link_TL-R460.jpg
    196.8 KB · Views: 1
  • TL-R460 v5_Datasheet.pdf
    922.2 KB · Views: 0
  • rtl8196c.pdf
    755.2 KB · Views: 0
  • ESMT_M12L64164A.pdf
    731 KB · Views: 0
  • 201163017532915.pdf
    1.2 MB · Views: 0
The sensors disabled, but shifted in time 08:30:00 to reproduce by the phenomenon. Well, go look for a new bunch of 'motherboard - memory "to the guys in their warehouses for put microATX MSI G41TM-P33 Combo (chipset Intel G31, G33, G41, 43, Q45 Express bus PCIe x16 according to the technical documentation is implemented as a Gen 1.0 because they integrated graphics multiplexed bus to the port PCIe), and we were in the area is now only sell it as there is no special desire, but the same MSI G41TM-P33 on my shelf lies there with G41TM-P33 Combo only one difference - you can't install either DDR2 or DDR3, at G41TM-P33 only DDR2 slots there. :)

P.S.

I added a new debug log (in Zip - 45 Mb) recorded for about one hour of operation after the occurrence of the phenomenon and restart HWiNFO64 to include debug mode settings (DebugMode=1).
 

Attachments

  • HWiNFO64.DBG.zip
    627.4 KB · Views: 1
Which problem is the latest DBG capturing, the missing memory module information (which can be seen there), or the high system load ?
I'm not sure if I understand, but is the high CPU load resolved now?
 
I hope that with the change chords "board - RAM" phenomenon persists - yesterday I took another new set of Gigabyte Z68AP-D3 (s1155) plus two modules of DDR3-1600 4GB and the processor Core i3-2120. So engaged upgrade machines - to their new kit for its problematic (MSI P45D3 Platinum + Core 2 Duo E8500 + 4*2 Gb DDR3-1333 with the replacement video card Palit GTX 550 Ti per ASUS GTX 550 Ti, Palit GTX 550 and Ti and P5Q SE + C2D E8500 + 2*2 Gb DDR2-800 Kingston KVR800N6/2G replace the mother P5QL/EPU + C2D E7300 + EVGA GT 430, well, very problematic couple go on an exchange or if a friend has a set of doubles or the stand with ASUS P5QL/EPU and go to the C2D E7300 and EVGA GT 430 - there are enough of these glands). I think after this problem is solved. :)

P.S.

Simply game "Fifteen" with the change of equipment. :) The new memory I checked with the help of MemTest86+ v5.10 Pro - four passes took about 2 hours 16 minutes in the x64 mode addressing, any errors not detected, so that we can only work with a screwdriver and edit config OS, well, the latter is not tricky sysinstall in BSD UNIX make 90% for me and the rest of the edit or vi right. :)
 
Well, a nuisance to the Gigabyte Z68AP-D3 Rev. 2.0 met - its USB3 ports give the load current is less than 0.9A who takes HDD Samsung P3 Portable USB Device (ST1000LM025 HN-M101ABB, 1 TB, the current consumption of the HDD 0,9A) - because it shows that he does not spin the spindle . Problem was solved by setting the machine on board Etron EJ168 has PCPlug connector to power the device from the power supply, well and asked colleagues from Gigabyte about what the maximum current load power ports give boards. I wonder what they will respond to the idea of supplying additional power from the + 5V bus with PD. Well, because the board uses the same chip EJ168 problems with it like it is not revealed. And the car is now a problem to loop. :)
 

Attachments

  • samsung-p3-portable-external-ds.pdf
    539 KB · Views: 0
  • ST1000LM025_HN-M101ABB_DONOR_DRIVE-1.jpg
    ST1000LM025_HN-M101ABB_DONOR_DRIVE-1.jpg
    215.4 KB · Views: 1
  • ST1000LM025_HN-M101ABB_PC_REV_01_R00-1.jpg
    ST1000LM025_HN-M101ABB_PC_REV_01_R00-1.jpg
    204.7 KB · Views: 1
I suspected cause of the failure to find - memory modules in conflict and it is manifested as the OS and application failures. Changed iron and like (touch wood :)) the problem went away on long distance and blue mist Astral. :) Well, there it and the road. :)
 
All the problem decided to just - picked up the modules again, replaced two piece of iron. And there was never found, but clearly impose a series of random factors that are so evident.
 
Back
Top