New Version 6.2
Hi all, I built a version 6.2 with the following new features:
- Selection of log-application via command-line-argument
- Optional file "GenericLogViewer.cla" for better "Open with ..."
- Adjustment of hot keys
- All "value checks" are disabled (gone)
Selection of log-application via command-line-argument
There are four new command line arguments (keywords = log-application names):
- Afterburner
- AIDA64
- HWINFO
- GPU-Z
If one of these words is defined as command-line-argument, you will not be asked for the log-application when opening the first log file, because it's already known to the Generic Log Viewer.
Optional file "GenericLogViewer.cla" for better "Open with ..."
The problem with Windows "Open with ..." is, that you cannot define command-line-arguments (unlike a desktop shortcut). Since version 6.2 you can pass command-line-arguments to the Generic Log Viewer also in "a file". If there is a file "GenericLogViewer.cla" in the same directory as the executable "GenericLogViewer.exe", "GenericLogViewer.cla" is read at startup and evaluated for command-line-arguments (for more info see example file "_GenericLogViewer.cla", is part of the release zip).
Adjustment of hot keys
I prefixed the single letter hotkeys (C, D, H, R and S) with "Alt + ...", because e.g. logging categories like "CPU ..." couldn't longer "quickly selected" (filtered) by clicking on letter C (see
Post #138).
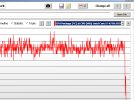
All "value checks" are disabled (gone)
Regarding discussion in
Post #147 and ealier, I switched off all "value checks/optimizations". Now all diagrams show "pure log-data", e.g. the HWINO FPS-limit of 500 is also gone.
Enjoy the new features
Tom


")


") (you should always do this anyway)
(you should always do this anyway)