LogViewer for HWINFO is available !

Characters from logs are displayed incorrectly in non-Latin encodings. On the screenshot is my native Russian

Since the beginning of time that is Win 95, I am using Operating system with American language and Greek language support.
Microsoft is responsible that Cyrillic version of windows this has such a bug, at HWINFO recording session.
 
Since the beginning of time that is Win 95, I am using Operating system with American language and Greek language support.
Microsoft is responsible that Cyrillic version of windows this has such a bug, at HWINFO recording session.
Please tell me how can I fix this problem in my Windows)
 
Characters from logs are displayed incorrectly in non-Latin encodings. On the screenshot is my native Russian


This is because the CSV file log is encoded in ANSI format (not Unicode nor UTF-8), so the character set used depends on your "Current language for non-Unicode programs" setting in Windows and should be as such imported by GenericLogViewer.
You can work-around this by switching the language to default English in HWiNFO.
 
Hi all,

Generic Log Viewer opens HWiNFO-Logfiles with "Codepage-1252" encoding (link), so that e.g. the degree symbol ° is shown correct.

Regards Tom
 
Introduction
Sometimes I use HWINFO together with FRAPS to run the in games included benchmark to optimize the settings of my graphic adapter! It's the only tool combination I know which logs FPS reliable. But analyzing the logs can be tricky. Of course, you can open a log-file in Excel, but then you have to do a lot of steps until you get an useful diagram (and not everybody has an Excel license).

So ... I decided to implement a simple tool which shows diagrams of log files after "a few clicks":
  • it allows to illustrate HWINFO log data in several diagrams and
  • to compare multiple log-files side-by-side in one diagram !
View attachment 815

User Guide (on YouTube)
The tool is very simple to use: no installation necessary, just start "GenericLogViewer.exe". At the top you can select
  • how many diagrams with
  • how many log-files
should be presented by the tool.

Open an HWINFO log file by clicking the "Open File" button, select application type "HWINFO", select a HWINFO log file and press "Open" (HWINFO log-files have typically the filename pattern: *.csv). After parsing the file, the logging duration of the file is shown and by default the "Timeline" diagram of the first log category. You can change the shown diagram with:
  • Timeline/Statisic RadioButton
  • Log Category ComboBox
  • Change all buttons (changes category in every diagram)
The Y-axis shows the values of the seleted Log Category in ComboBox (unit is within [..])
In upper left corner of every diagram you can find the minimum, average and maximum value of the corresponding curve(s).

If an opened file is still updated with logging-data by HWINFO, you can simple update/refresh it by clicking on the "Reload"-Button.

If there are too many different values on Y-axis in "Statistic" mode, the values are grouped into ranges. If this is the case, the following control is shown, which allows to increase of decrease the number of ranges (or to disable quantisation).

View attachment 814

After opening all log files you can hide the file area by unmarking "Show file area" to get more space for diagrams.


New feature since version 2.1: Simple Mode
I added a "two columns" feature, which doubles the number of diagrams. But if you use "two columns" with a high "number of diagrams" the diagrams are very small. That's why I introduced the "Simple mode" which:
  • simplifies header and footer
  • decreases line thickness
Tip: use the "Tab"-key to toggle between 'Standard' and 'Simple' mode !


New feature since version 3.0: Time Window Definition
If you click the "Edit"-button in the file area, a new window will be opened to define Start- and End-time of a time window for the logfile (see user guide at the top of this window). It allows you
  • to show only a part of a single logfile or
  • to synchronize multiple logfiles
Attention: time window start-time is "normalized" to "00:00:00", otherwise synchronization of multiple log-files will not work !

Button description:
  • "Set": defines Start/End time of time window
  • "Reset": resets Start/End time to "file borders"
  • "Zoom": zooms into diagram with the actual defined Start/End times for fine-tuning (from Start-10% to End+10%). Remark: works only in case of Start/End is more then 10% from "file Start/End times")
  • "Cancel": closes window without any change
  • "Execute" ="Apply" in actual version: yes, take the actual defined Start/End times as the used time window for all diagrams !
View attachment 899


New features since version 4.0 (August 2018):
  • possibility to compare different categories of one file in one diagram
  • possibility to present diagrams in a "dark style"
If you have only file loaded, it's now possible to add up to two more ComboBoxes for category selection in any diagram. Addtional you can change the background color of the diagram section to black.

View attachment 2985


New features since version 5.0 (July 2019):
  • MSI Afterburner Logs are now supported too (*.hml)
  • "Statistic"-diagram got many improvements (now it works as it should)
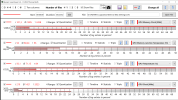
  • New diagram-type "Triple" implemented , which shows Minimum, Average and Maximum in a barchart
View attachment 3533


New features since version 5.2 (November 2019):
  • Ability to load/save setups of LogViewer (see Post #94 for details)
  • Save Screenshot functionality
New features since version 5.4 (October 2020):
  • "Reload file" button can be configured to display only the "last x minutes" (see Post #104 for details)
New features since version 6.0 (May 2021):
  • Command Line Arguments
  • Drag & drop of files
  • "Change all" buttons with SMART-functionality
  • For details check this video on YouTube
New features since version 6.1 (July 2021):
  • Style your own Generic Log Viewer MainWindow ... if you like
  • Diagrams can now be "locked" (for "Change all" buttons with SMART-functionality)
  • Some new "Hot-Keys" are implemented
  • For details check Post #136
New features since version 6.2 (November 2021):
  • Selection of log-application via command-line-argument
  • Optional file "GenericLogViewer.cla" for better "Open with ..."
  • Adjustment of hot keys
  • All "value checks" are disabled (gone)
  • For details check Post #150
New features since version 6.3 (April 2022):
  • "Selfie-Mode" for better screenshots
  • Category ComboBoxes have now color-markers on the left side
  • Screenshot functionality improved
  • For details check Post #163
New features since version 6.4 (Mai 2022):
  • "Marker-Mode", which allows precise determination of every single log value
  • Added support of single concatenated header logfile
  • For details check Post #172
Requirements
  • Microsoft Windows
  • Microsoft Framework .NET 4.8 (Windows Update 1903 from April 2019)
  • no installation necessary, just start "GenericLogViewer.exe"

Download
SHA-1 hash: 2F19F0ABC093E495617B15663E1537D436643934
Download - GenericLogViewer - Version 6.4
Thank you so much for the tool! I simply wanted to view my log file to determine how well my new graphics card would handle. I am using a new EVGA RTX 3090 card with a beautiful Samsung QLED 8K 75in tv as my desktop display. I wanted to record my GPU temps while running this tv as my display at 4K resolution (120 refresh rate), while playing & screen recording Doom Eternal (all settings w/ maxed out graphics, also at 4k res w/ 120 fps). This log viewer made it possible to do so, and I thoroughly appreciate it! I can see that my OC settings worked the way they should, and my limits were maintained. Thank you again, very much!
 

Attachments

  • Screenshot (9).png
    Screenshot (9).png
    622.3 KB · Views: 12
Hi ScrubLordeus,

thanks for your feedback. But it looks like you are using Generic Log Viewer on a very low resolution, because a lot of controls are hided. The Generic Log Viewer is optimized for native resolutions >= Full HD (1920 x 1080 at 100%). But I have a tip for you, Press F1 to open "Hot-Keys" window:

HotKeys.png

Ctrl + Tab switches on/off the "selfie mode", which is optimized for "presentation purposes":
  • all controls are hided
  • only necessary information is shown
  • header line can be edited, e.g. to document setup/test case -> click into it
  • works also fine on low resolutions (<= Full HD)
Alt + C saves your diagrams in a screenshot, with automatic activation of "selfie mode"

Hope these tips will make your work with GenericLog Viewer even more effective ...

Regards Tom
 
Hi Tom, and Happy Thanksgiving.

It's been a while since I have used GLV. Today I was running v6.4 and noticed two things.

  1. If the program is NOT maximized, when I click the camera icon, it takes a screenshot as expected. If the program IS maximized, when I click the camera icon it takes a screenshot of the entire Windows raster, which in my case is 5 displays. I don't recall running into this back in April and May of 2022 when I was helping you debug some things. Maybe I never had GLV maximized then. Is this the intended behavior or a bug?
  2. More importantly, I am trying to "inject" data from a CSV file generated by AquaSuite into a CSV file generated by HWINFO. Why I am trying to do this is a long story, and not relevant to the problem I encountered. I figured if I format the data exactly the same, GLV should open the file. Sadly, this is not the case. I started experimenting, trying to figure out why.
  • I can open a CSV log file generated by HWINFO in Excel, look at it but not save it, then close it. In this case, GLV will open the file.
  • If I open the CSV file in Excel and then save it (still as a CSV) without making any changes to it, then try to open it in GLV, I get the error, "String was not recognized as a valid DataTime".
  • I open the file and save it (still as a CSV) with a different file name but make no other changes, I get the same error.
  • If I copy the file to another directory and then rename it, GLV will open the file.
This behavior suggests that opening the file in Excel and then saving it (still as a CSV) is somehow changing the contents of the file, which prevents GLV from opening it. If I compare the original CSV file and the copy, they look exactly the same. I even tried an Excel compare add-in but it would not process CSV files. I am confident that I can make the data exported from Aquasuite exactly match the format GLV expects, but it's pointless because just opening a HWINFO CSV file and then saving it is somehow making it not open in GLV. Any idea why this is happening?

Many thanks,
 
Hi SpeedyIV,

OK, here are my comments to your questions:
  1. No, it's not a bug and the behavior of the screenshot feature hasn't changed since release version 5.2 (code is the same). But yes, the whole "virtual screen" of Windows is taken. I still think that's fine, because e.g. if you have a double screen setup it's normal that it's used as one single screen (e.g. mouse moving over screens). Maybe someone maximized GLV over both screens, so screenshot should cover whole picture. The GLV don't know, how many screens with which resolution are used, for GLV it's "one virtual screen" (SystemParameters.VirtualScreenLeft, ...Right, SystemParameters.VirtualScreenWidth, ...Height).

  2. It would be helpful if you had uploaded all these files ... But there are many things which can go wrong: the default delimiter for Excel CSV-Exports depends on the Windows System Separators, which are system language specific, can be ";" or "," or ... Another point is with which encoding is the text stored? UTF-8, UTF-16, ... Best idea is you do an upload of these files, I don't believe "they look exactly the same". Maybe if you open them in an text-editor, but not if you do "binary checks" or compare them with tools like "Beyond Compare" (which I typically use).
Regards
Tom
 
Hi Tom,

Thanks for getting back to me so quickly. Item 1 explanation is noted and makes perfect sense. I guess I just never noticed it before.

Regarding item 2, apologies for not attaching the CSV files. The attached zip file has 2 CSV files in it. Format Test 1.csv will open in GLV. Format Test 2.csv was created by opening Format Test 1.csv in Excel and then saving it with a new name. I was worried that perhaps zipping the files would do something to them so I made the zip file, copied it to another directory, unzipped it, then tried opening the 2 files. GLV will open Format Test 1.csv but will not open Format Test 2.csv. Note that I did not import these files into Excel. I just opened Format Test 1.csv, clicked Save As, then changed the name to Test 2.csv

I will check out Beyond Compare. In the meantime, I would appreciate it if you would check these 2 files. I really like GLV and hope I can find a way to sneak some Aquasuite data into a HWINFO formatted CSV file and get GLV to open it. Thanks again.
 

Attachments

  • GLV CSV Format Test Files.zip
    46.5 KB · Views: 3
Hi SpeedyIV,

OK, I downloaded your files and immediately wondered how you can think that these files are the same (???):
  • filesize "Format Test 1.csv": 210'088 bytes
  • filesize "Format Test 2.csv": 178'997 bytes

Beyond Compares shows the problem:

BeyondCompare.png

The second column ("Time") has lost the hour information, that's the reason why GLV can't use the data of the "Time" column as a valid time-string, Error Message: "String was not recognized as a valid DataTime"! That the millisecond resolution is also gone doesn't matter.

OK, I fixed that in another file "Format Test 3.csv" ... and it works, file can be opened with GLV !

How did I fixed it? I did some "Find -> Replace" stuff with a good textfile editor (I recommend free editor "Notepad++") :
  • Find "24.11.2022,3" and replace it with "24.11.2022,14:3" ... must be done for all 10 minute periods
  • Find "24.11.2022,4" and replace it with "24.11.2022,14:4"
  • ...
  • Find "24.11.2022,0" and replace it with "24.11.2022,15:0" Attention: hour change
  • ...

Regards
Tom
 

Attachments

  • Format Test 3.zip
    23.6 KB · Views: 2
Hi Tom,

Wow. I am an idiot. I totally did not notice that the file sizes were different and can't believe I did not see this. Apologies for missing this obvious difference.

I opened them again and changed the format of the time entries to h:mm:ss and can now see the difference. In the Test 1 file, the time is 14:37:41 but in the Test 2 file, it's 0:37:41, so the hours field value has been lost. I don't know how to format a time value to show ms but I can see that the time value has been rounded up to the nearest second (41) based on your screenshot which shows it's really 14:37:40:500.

I don't know why Excel would do this when all I did is open the file, then do File - Save As, then type in a new file name. Whatever the reason, now I know what I need to do. Sorry to trouble you with this and thanks again for your help.

Edit to add - It Worked! I was able to paste in the data from Aquasuite's log along with its time stamps, then sort by time to feather them together. I found that after changing the format of the time values to h;mm;ss I can save the file and GLV can open it after doing so.
 
Last edited:
Hey there. I really appreciate this tool. Been using it for a year or so now probably. Do you think you can add support for Intel's "PresentMon"? It also outputs to a csv file.
 
Hehe ... if Intel sends me a Core i9-13900K + 500 bucks for a motherboard, I will do it :cool:

@NCSGeek: Can you upload an example-CSV to check if it's possible ...
 
Hehe ... if Intel sends me a Core i9-13900K + 500 bucks for a motherboard, I will do it :cool:

@NCSGeek: Can you upload an example-CSV to check if it's possible ...
Hey, thanks for your reply! Sure, here is a short sample of it's csv output.
Download (I used discord CDN for this temporary upload)

If you have any issue with that download let me know. I think it'd be very nice to have this supported since PresentMon captures "GPU Busy" as a new metric. Gamers Nexus recently made a video going into it and it seems to be a very useful metric.
 
I'm wondering how is this "GPU Busy" parameter different from the "classic" "GPU Usage".
 
I'm wondering how is this "GPU Busy" parameter different from the "classic" "GPU Usage".
It relates to a specific part of the GPU render pipeline rather than overall utilization of the GPU. There's no way I can explain it better than GN's video though, so here's a link if you're interested.
YouTube
 
OK, I took the "pmcap.csv"-file of @NCSGeek and did some "quick hardcoded stuff" with Generic Log Viewer and it worked :cool:

Here is a GLV Screenshot of "Intel PresentMon" Data:

Screenshot.png
 
Back
Top