Prometheus Adapter for HWiNFO (+ Grafana Dashboard)

Kallex

Well-Known Member
I'm happy to announce first public beta release of PromDapter - customizable Prometheus Adapter for HWiNFO.

My personal motivation was to get centralized dashboard of small cluster of computers (3-5 in my case) to be part of home automation. When joining the Folding@Home and Rosetta@Home (and BOINC) in general pushed the need even further. So HUGE thanks to Martin, here we are with first public released version.

My main design goal was to create user-customizable adapter; right now the customization is combination of named Regexp capture groups, which work nicely with optional renaming of HWiNFO sensors (for example match Ryzen 1xxx, 2xxx and 3xxx generations temperature sensors). I aimed to provide enough content out-of-the-box so that those interested, can get something useful immediately.

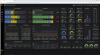
Without further ado, I've described most things in README.txt (attached here and in the release package). I've also attached example screenshot of dashboard and example of metrics output to get the idea what it does (especially if one is familiar with Prometheus metrics).

Please read the README.txt properly to understand what limitations there are.

NOTE! This is first beta-release, whereas it shouldn't mess your system, I'm not completely satisfied with installer's behaviour as of yet.


Releases are published now and in the future in GitHub:
https://github.com/kallex/PromDapter/releases

I'll keep following this thread for immediate support, but you might also post issues in GitHub if you feel like (I try to monitor that as well).
 

Attachments

  • HWiNFO Home Cluster - example.png
    HWiNFO Home Cluster - example.png
    267 KB · Views: 647
  • README.txt
    1.6 KB · Views: 253
  • metrics.txt
    60.5 KB · Views: 188
Apparently I failed to rebuild the HWiNFO provider properly after purchasing the license to obfuscator, so the trial version caused the 0.9.14 to expire 8th of April (as of about an hour before this posting).

So 0.9.15 beta isn't feature wise different, but it shouldn't expire *knocks on wood*. Sorry for any trouble it caused to anyone, the setup in place upgrades the existing so its simple to deploy.
 
I'm happy to hear that :). Please let me know if you miss something in that, so I know to prioritize the development accordingly.

I'll add more generic configuration next as well as clean up some of the event logging (not a big deal, but it does repeat the error every time when polled, which unnecessarily floods the logs for example when HWiNFO sensors are not available). I am going to add sensor "renaming" (name mapping) on configuration side, because its more controlled in that fashion and doesn't require tweaking with HWiNFO per computer basis.

Fan "support" is also lacking right now, I think sensor type needs to play a role in regexps, so I need to extend the model to include that as a configuration. Fans do work, but distinguishing them from other sensors is unnecessary tricky, as the "fan" doesn't and shouldn't have to appear in the name of the sensor to be recognized as a fan.

I'm also testing to add Linux-support to support the command-line-tool output parsing and mapping, which seemed the way to go.
 
Hi Kallex,

Great job there ! I installed the whole thing (Prometheus, Grafana and your adapter) in a couple of hours and now I can enjoy my GPUs' temps on my iPad :cool:. Thank you very much!

Would you be able to post a bit of info on how to configure the mapping in Prometheusmapping.yaml. I have a few sensors that are not available while I would expect to see them (e.g.
CPU Package Power). I started looking at the code but I'm not a C# developer and I don't know how to build stuff on Windows.

Thanks again
 
EDIT: If you have no previous experience of .yaml file editing, take a backup before editing. Yaml is sensitive to indenting of the file, so amount of spaces in the file matter.

I'm glad to hear that!

The basic design principle was indeed, that modifying the .yaml file should be enough for metric customization. While it isn't the case yet for certain cases, CPU Package is one, that should work with minor adjustments.

My current CPU Package Power sensor is named exactly as: CPU Package Power (SMU)

My initial .yaml regular expression expects to see the the part in the parenthesis as well, which might be the issue its not picking your CPU Package Power.

1. Quick fix
- You can try to add following line to .yaml (and might have to restart the service, I'm not entirely certain if it picks up the modification on-the-fly (I think it should, but I wouldn't count on it)).

- '(?<Entity>CPU) (?<MetricName>Package Power|Core Power|SoC Power)'

The line needs to be added in the first part, so if you put it after/alongside other # CPU / Package lines, it should work OK.

2. More detailed customization
- Use .NET regular expression tool, such as http://regexstorm.net/tester
- Enter your sensor name in "Input" field
- Enter the Regexp to customize in "Pattern" part

You can test with the current test:
- Input sensor: CPU Package Power (SMU)
- Pattern: (?<Entity>CPU) (?<MetricName>Package Power|Core Power|SoC Power) \((?<MetricCategory>[^)]+)\)

Table should show:
- Matched string: CPU Package Power (SMU)
- ${Entity}: CPU
- ${MetricName}: Package Power
- ${MetricCategory}: SMU

Now if your CPU Package Power is written like that without the (SMU) part, you can test the quick fix above as:
- Input sensor: CPU Package Power
- Pattern: (?<Entity>CPU) (?<MetricName>Package Power|Core Power|SoC Power)

Table should show:
- Matched string: CPU Package Power
- ${Entity}: CPU
- ${MetricName}: Package Power

... end result would be, that the additional category of (SMU) wouldn't be available (as its not available in your sensor either), but other than that, the Prometheus output in should now show it, and it would work with exactly same name in Grafana, just without category-attribute of SMU (which is not needed, unless you specify it as a condition in Grafana part).

I hope this example makes sense. If it doesn't work, can you paste the exact names of your sensor(s) that aren't working, or post a screenshot of HWiNFO and I try to fix the .yaml for you.
 
... also, quick and dirty fix for uniforming the sensor names is to rename them in HWiNFO. While this is far from perfect (the renaming is user-specific), its quick to do and test out... and its in fact the way I aligned Ryzen 2700X with its temporary sensor difference to my Ryzen 1xxx and Ryzen 3xxx sensors.
 
Last edited:
Hi,

Thanks for the quick and detailed answer. Unfortunately, not everything works as expected. I started modifying the config file but I couldn't make it work. Calling the endpoint metrics/reset or restarting the service (ensuring it was down before) doesn't pick up the latest config. Actually, I tried removing the file altogether and the service still starts without any problem. Do you have a default hard-coded config that is somehow used instead of the config file? I couldn't find anything in the code but again C# and Windows are not my domain...

On a positive note, I'm able to rename the sensors to whatever will make a match in the regex and, therefore, get the CPU Package Power in Prometheus.

Cheers
 
I believe its my fault - for not being clear about which config file to modify. There are two configs. One for "reference" and one that's actually used.

The actually used config is located in common application data location, that is usually around C:\ProgramData\PromDapter

I hope this was the issue and you'll get it fixed this way :).
 
Brilliant ! My brain wasn't reading all the words and ProgramData was becoming Program Files. My mistake as it is clearly written in the README; Yet another example of RTFM :rolleyes:

Anyway, I changed the regex to
'(?<Entity>CPU) (?<MetricName>Temperature|Power|Package Power|Core Power|SoC Power) \((?<MetricCategory>[^)]+)\)'

and metrics/help returns the additional metrics
# HELP hwi_cpu_package_power CPU Package Power - Power Consumption
# HELP hwi_cpu_power CPU Power - Power Consumption
# HELP hwi_cpu_temperature CPU Temperature - CPU & Aux Temperatures


Cheers for that !
 
Cool cool!

I'm happy we got it sorted out quickly enough :)

As I said, its not clear... I should rename the "reference" properly so that it's not easy to be mistaken like that in the future.

I have few ideas of listing the "unmatched/missing" metrics as well properly to be identified clearly, and provide better dynamic support for editing/supporting regex commonly too. As of course everyone's systems metrics are some way different, and the basic idea is to support as much as possible out-of-the-box.

But in the meantime, I try to support and fix any issues like this as fast as possible.
 
Another question...

How come that some times the metric will be suffixed with the units and some times not?

With the same regexes on 3 different PCs, I get twice the metrics with the units and once w/o. For example:

- Regex: (?<Entity>Core) (?<CoreNo>\d+) (?<MetricName>VID|Clock|Ratio)
- Output with units: hwi_core_clock_mhz{coreno="0",unit="MHz",sensor_type="SENSOR_TYPE_CLOCK",sensor="Core 0 Clock (perf #1)",source="CPU [#0]: Intel Core i7-9700K"} 4996.35
- Output w/o units: hwi_core_clock{coreno="2",unit="",sensor_type="SENSOR_TYPE_CLOCK",sensor="Core 2 Clock (perf #3)",source="CPU [#0]: Intel Core i9-9900K"} 4998.8

This is systematic, if I've got units it's for all metrics and the other way around.

Cheers,
B
 
Current version takes the unit from the sensor data as-is, without any adding or filtering. So I believe the difference comes from the sensor/driver or how HWiNFO represents it.

I think I understand the problem here; I propose we add a layer of customization in Regex definition (or right beside it), for overriding the unit (possibly optionally if its missing). I'll think a bit how to best approach this.

Few checks to narrow the difference down a bit:

1. Does HWiNFO display the Mhz in its "Sensor Status" window for both the systems alike?
2. Are you running the same version of HWiNFO on both systems?

For me it does display MHz alike on all my different generation (1, 2, 3) Ryzen systems.
 
There was a bug in older versions of HWiNFO where reporting of units didn't work in some cases.
Please make sure you're running the latest version of HWiNFO, I'd recommend to use the latest Beta v6.25.
 
This is systematic, if I've got units it's for all metrics and the other way around.

I didn't spot this properly at first. I'll add a separate layer outside the regexps where you separately can dictate the units per identified sensors. Might be regexp based itself.

I also think we can (ab)use the existing working system as a base. So that you could "export" the unit data from existing system and feed it as a config "your alike sensor-metric should have matching unit".
 
Oh thanks Martin! I'll wait and see if we need to do anything in the PromDapter layer after all :).
 
Current version takes the unit from the sensor data as-is, without any adding or filtering. So I believe the difference comes from the sensor/driver or how HWiNFO represents it.

That's what I thought as well by looking at the code where you do the following

var unit = item.Unit;
var sensorName = item.Name;
var sensorType = item.Category;
var sourceName = item.Source.SourceName;
metadataDict.Add("unit", unit);
(...)
if (!String.IsNullOrEmpty(unit))
{
metricName += "_" + unit;
}
(...)


So it seems that the Unit elements returned by the HWiNFOProvider are empty. By the way, where is the code of this HWiNFOProvider? How do you include/import stuff in C#?


I'll give it a try with the latest HWiNFO version (beta), as suggested by Martin, since I run 6.24-4120 on all the systems. I'll update the offending one first and keep you posted.
 
HWiNFOProvider uses not-publishable parts/technology, but it's as lean as possible and brings the data transparently through.

The include/import part of alike libraries is done (often, and in this case) through Nuget packaging, but the package is not included in the repository, so its not buildable alone.

Also when you monitor the results in HWiNFO, pay attention are you seeing the MHz or other units in the UI as well, or just numbers without any units - that would give you the symptom straightforward.

Regardless of the outcome, it the units are the issue, we can address them at PromDapter layer as well.
 
I've just installed 6.25-4150 and the units are now available :cool:

The support you guys give is amazing !!!

Here is the metrics with 6.25-4150 and the same regex as before: hwi_core_clock_mhz{coreno="2",unit="MHz",sensor_type="SENSOR_TYPE_CLOCK",sensor="Core 2 Clock (perf #3)",source="CPU [#0]: Intel Core i9-9900K"} 5001.2

Thank you so much for the fast and efficient help,
B.
 
Ok this was exactly what I was looking for I just can't thank you enough!!
Testing all this with great exitation! :)

I am having some trouble with the "Prometheusmapping.yaml" file.
Trying to add the Fans and Temperature from the motherboard sensors (ASUS)

If I add:
- '(?<MetricName>.*)
I can see them:
# HELP hwi_chassis1_rpm Chassis1 RPM - ASUS P6T DELUXE V2 (Winbond/Nuvoton W83667HG) # HELP hwi_power_pout_w Power (POUT) W - ASUS P6T DELUXE V2 (On Semi ASP0800 (ASUS EPU2)) # HELP hwi_motherboard_c Motherboard °C - ASUS P6T DELUXE V2 (Winbond/Nuvoton W83667HG)

But i have an hard time filtering by Entity, MetricName or MetricCategory. The fact is 1 i suck a RegEx, 2 i'm not 100% sure at whats values Entity, MetricName or MetricCategory make reference.

Another question i have is the <AggregationType>Average value an average since the startup of hwinfo (I'm pretty sure it's that), or since the last time we got the value?
 
Last edited:
Back
Top