Kiriakos-GR
Well-Known Member
Hi Tom,
All understood.
I will simply add a teaser")
Personally I will never need to use this software at a greater extend.
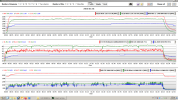
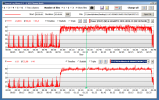
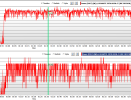
I am now capable to compare entire system thermals, all seasons of a year (when gaming) = under max stress.
I did use the filename as environmental temperature marker.
All understood.
I will simply add a teaser
Personally I will never need to use this software at a greater extend.
I am now capable to compare entire system thermals, all seasons of a year (when gaming) = under max stress.
I did use the filename as environmental temperature marker.


")


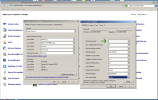
 . But I think you have a laptop with a high DPI screen and use a scaling > 100% in the Windows settings (?)
 .
.