Prometheus Adapter for HWiNFO (+ Grafana Dashboard)

Thanks for your info. After I noticed that the whole GUI uses the clients and not the servers performance I decided to swap the database and grafana to my Pi 3B+ which runs 24/7 anyway. It runs very smooth as well (except for some currently unsolved firewall issue during startup, but that's some different) with an update rate of 1s. Interestingly the CPU+GPU graph is working as well now, either I loaded an older version oder changed something by mistake during the first installationo_O
Currently I only monitor my main PC. Before I try to adapt specific sensors I would like to know how it's possible to monitor e.g. 2 PCs in one graph. I guess that the data must enter the Prometheus database with a PC specific tag/flag. Therefore I guess I have to adapt the PromDapter per PC so be able to load the hwi-values depending on the PC?
 
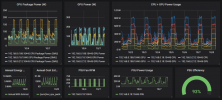
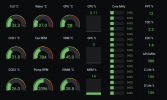
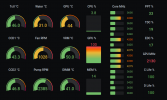
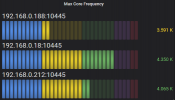
The example graph picture is showing my 3 PCs actually :). Prometheus includes by default (or at least my installation does) "instance" information that includes host:port, so you get to aggregate them by default. Just add all the PCs IPs to scrapers and you're good to go.

I've planned to add computerName - category/attribute to the PromDapter, but I'm not sure if its better still to do on Grafana-side of valuemapping... but without it, you should just have "instance" in there to separate the comps regardless.
 
Hi!
So question for you.
I'm going through some of the metrics that I'm interested in adding on my end.
Is it of any use to you to eventually share the diff in the mapping yaml? And if so better do it here or on github?
 
Yes that would be nice!

I can merge all the customizations in so that they are included in future releases. Here or GitHub is OK, whichever you prefer.
 
Is there any way to filter by source name? I took a quick look at the source code and it doesn't seem like it's possible. For example I want only metrics from "Aquaero", note that I've renamed the sensors in hwinfo. I can work around it by using something like '(?<MetricName>(Ambient|Delta|Fans|Pump|Water))' but it's kinda ugly and easy to break.
Code:
# HELP hwi_ambient_c Ambient °C - Aquaero
hwi_ambient_c{unit="°C",sensor_type="SENSOR_TYPE_TEMP",sensor="Ambient",source="Aquaero"} 27.8
# HELP hwi_delta_c Delta °C - Aquaero
hwi_delta_c{unit="°C",sensor_type="SENSOR_TYPE_TEMP",sensor="Delta",source="Aquaero"} 4.78
# HELP hwi_fans_rpm Fans RPM - Aquaero
hwi_fans_rpm{unit="RPM",sensor_type="SENSOR_TYPE_NONE",sensor="Fans",source="Aquaero"} 321
# HELP hwi_pump_rpm Pump RPM - Aquaero
hwi_pump_rpm{unit="RPM",sensor_type="SENSOR_TYPE_NONE",sensor="Pump",source="Aquaero"} 1399
# HELP hwi_water_c Water °C - Aquaero
hwi_water_c{unit="°C",sensor_type="SENSOR_TYPE_TEMP",sensor="Water",source="Aquaero"} 32.58
JSON:
[
  {
    "unit": "°C",
    "sensor_type": "SENSOR_TYPE_TEMP",
    "sensor": "Ambient",
    "source": "Aquaero",
    "value": 27.92,
    "valueType": "Double",
    "metadata": {
      "metricName": "Ambient"
    },
    "metric": "hwi_ambient_c"
  },
  {
    "unit": "°C",
    "sensor_type": "SENSOR_TYPE_TEMP",
    "sensor": "Delta",
    "source": "Aquaero",
    "value": 4.44,
    "valueType": "Double",
    "metadata": {
      "metricName": "Delta"
    },
    "metric": "hwi_delta_c"
  },
  {
    "unit": "RPM",
    "sensor_type": "SENSOR_TYPE_NONE",
    "sensor": "Fans",
    "source": "Aquaero",
    "value": 0.0,
    "valueType": "Double",
    "metadata": {
      "metricName": "Fans"
    },
    "metric": "hwi_fans_rpm"
  },
  {
    "unit": "RPM",
    "sensor_type": "SENSOR_TYPE_NONE",
    "sensor": "Pump",
    "source": "Aquaero",
    "value": 1319.0,
    "valueType": "Double",
    "metadata": {
      "metricName": "Pump"
    },
    "metric": "hwi_pump_rpm"
  },
  {
    "unit": "°C",
    "sensor_type": "SENSOR_TYPE_TEMP",
    "sensor": "Water",
    "source": "Aquaero",
    "value": 32.36,
    "valueType": "Double",
    "metadata": {
      "metricName": "Water"
    },
    "metric": "hwi_water_c"
  }
]
 
Right now it isn't possible, but I'll see what I can do. Initially I didn't consider the metric names being good to just "pass through as-is", but of course when renamed, that's a common case.

I think PromDapter should support renaming as well, and that would further justify the source-based filtering too.
 
Just for heads up, I'm closing in to adding configurable support for WMI providers; that is tons of metrics available for Windows. Below some examples in Prometheus and JSON formats:

# HELP filesystem FileSystem - Win32_LogicalDisk
filesystem{name="B:",unit="",sensor_type="Win32_LogicalDisk",sensor="FileSystem",source="Win32_LogicalDisk"} NTFS
filesystem{name="C:",unit="",sensor_type="Win32_LogicalDisk",sensor="FileSystem",source="Win32_LogicalDisk"} NTFS
filesystem{name="D:",unit="",sensor_type="Win32_LogicalDisk",sensor="FileSystem",source="Win32_LogicalDisk"} NTFS
filesystem{name="S:",unit="",sensor_type="Win32_LogicalDisk",sensor="FileSystem",source="Win32_LogicalDisk"} NTFS
filesystem{name="T:",unit="",sensor_type="Win32_LogicalDisk",sensor="FileSystem",source="Win32_LogicalDisk"} NTFS
filesystem{name="V:",unit="",sensor_type="Win32_LogicalDisk",sensor="FileSystem",source="Win32_LogicalDisk"} NTFS
filesystem{name="X:",unit="",sensor_type="Win32_LogicalDisk",sensor="FileSystem",source="Win32_LogicalDisk"} NTFS
# HELP freespace FreeSpace - Win32_LogicalDisk
freespace{name="B:",unit="",sensor_type="CIM_LogicalDisk",sensor="FreeSpace",source="Win32_LogicalDisk"} 285440958464
freespace{name="C:",unit="",sensor_type="CIM_LogicalDisk",sensor="FreeSpace",source="Win32_LogicalDisk"} 124438704128
freespace{name="D:",unit="",sensor_type="CIM_LogicalDisk",sensor="FreeSpace",source="Win32_LogicalDisk"} 467827486720
freespace{name="S:",unit="",sensor_type="CIM_LogicalDisk",sensor="FreeSpace",source="Win32_LogicalDisk"} 338795888640
freespace{name="T:",unit="",sensor_type="CIM_LogicalDisk",sensor="FreeSpace",source="Win32_LogicalDisk"} 591394574336
freespace{name="V:",unit="",sensor_type="CIM_LogicalDisk",sensor="FreeSpace",source="Win32_LogicalDisk"} 61769658368
freespace{name="X:",unit="",sensor_type="CIM_LogicalDisk",sensor="FreeSpace",source="Win32_LogicalDisk"} 86263934976

{
"unit": null,
"sensor_type": "Win32_LogicalDisk",
"sensor": "FileSystem",
"source": "Win32_LogicalDisk",
"value": "NTFS",
"valueType": "String",
"metadata": {
"name": "C:"
},
"metric": "filesystem"
},
{
"unit": null,
"sensor_type": "Win32_LogicalDisk",
"sensor": "FileSystem",
"source": "Win32_LogicalDisk",
"value": "NTFS",
"valueType": "String",
"metadata": {
"name": "B:"
},
"metric": "filesystem"
},
{
"unit": null,
"sensor_type": "CIM_LogicalDisk",
"sensor": "FreeSpace",
"source": "Win32_LogicalDisk",
"value": 86263934976,
"valueType": "UInt64",
"metadata": {
"name": "X:"
},
"metric": "freespace"
},
{
"unit": null,
"sensor_type": "CIM_LogicalDisk",
"sensor": "FreeSpace",
"source": "Win32_LogicalDisk",
"value": 61769658368,
"valueType": "UInt64",
"metadata": {
"name": "V:"
},
"metric": "freespace"
}

WMI gets access to all kinds of system stuff... also adding it in eases the path for adding more other providers in later. I needed it myself, but I hope others will like it too :cool: !
 
Thanks very much for this! It was just the catalyst I needed to actually properly understand how to setup Prometheus/Grafana finally :)
 
Some delay (other projects) to close up the WMI. Meanwhile I got the Corsair HX1000i PSU; here's the regexp and example images for PSU graphs (last 7 days in the example, except Efficiency is realtime one):

PSU data is from my main system only though as I don't have HXi series but only in that system. Energy and cost estimations are still from CPU + GPU aggregation.

Regex addition and example image below:

YAML:
# PSU
    - '(?<Entity>PSU) (?<MetricName>Temperature2|Temperature|Fan|Power \(sum\)|Power|Efficiency)'


PromDapter-PSU-example.png
 
I wanted to chime in here just to say thanks for creating this!

While I'm here I'll ramble a bit, hopefully it helps someone else giving this a shot from scratch.

I've been using HWiNFO for years even played around with some scripts+plugins to make a rainmaker (I think it was called) dashboard. But I always wanted it to be in a web page so I could view it on multiple devices. Everytime I'd start to get the ambition to try to figure out how I'd start to think someone must have done this or something similar before and I think I finally found those people! :)

Took me a good several hours to wrap my head around all the moving pieces here (having never touched Prometheus or Grafana).

If you're starting from scratch here's what I've learned (if I have something wrong please let me know)

This tool ties into HWiNFO and grabs its sensor data. If I understand correctly the .yaml mentioned in the readme file (Prometheusmapping.yaml) defines what Sensor data to pull out of HWiNFO and what its then called in Prometheus (I think... haven't gotten that far yet).

Do a little reading on Prometheus and its actually pretty simple. Run its (I'll call it) server edit its prometheus.yml file to add "targets" (aka the host you have this tool running on). Each polling period it does a simple HTTP GET to the host running this tool and grabs the data from http://your-host-here:10445/metrics. Kinda backwards of other monitoring tools where the clients PUSH their data to the server.

Setup Grafana configure a Prometheus data source and point it at the Prometheus server you setup. (make sure you remembered to turn off / open a rule on your HWiNFO hosts windows firewall.....) and HAZZAAAA! You've got data in grafana which will let you create all the pretty dashboards your heart desires.

I have a lot more work to do on this still..

No idea what data exactly is getting to grafana, need to go learn how to start looking at the data in the dataset
No idea if the data I want is even getting sent to prometheus to grab my specific hardware sounds like I may have to do some editing to Prometheusmapping.yaml

But this looks likes its going to be a fantastic solution, and I will stop getting annoyed every time my desktop "goes weird" and ALL the HWiNFO sensor windows I spent hours perfectly aligning to the nearest pixel reset to the default stacked on top of each other :eek:

Thanks again!
 
Thank you for simple writeup of "Getting started from scratch"!!!

The journey to "get sensors in data" seems to be neverending, I'm lacking bit behind of my ideas how to better handle the sensors. HWiNFO made it quite great initially, so many of the angles were working good (bit too well, so not requiring immediate improvement) as-is.

I try to get back on those few obvious additions still...
 
Made some more progress and ... I think... I may now be able to get everything from HWiNFO into Grafana!

What I've learned

What I think you have accomplished with the default Prometheusmapping.yaml is to pull in useful metrics likely to be common across all platforms. Basically I think the existing lines in there are doing something along the lines of "Hey look through all the sensors from HWiNFO, if any of them have "CPU" in the name map it to <some Prometheus category>."

There are probably much cleaner ways to get this done but this has worked for me (at least so far.. I'm only 2 graphs into my setup....

A spreadsheet is your friend! Answer these questions.

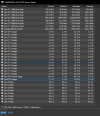
What is the name of the sensor you want data from in HWiNFO?

1602182240986.png

In my case here I want to grab "Total CPU Usage"

Now look at the Prometheus data that host is reporting. This you can grab from the http://<your host / ip here>:10445/metrics in your browser
Probably want to copy paste that into a text editor for reference as you go.

Search that for the sensor name you are looking for.

1602182380151.png

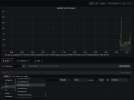
The 2nd line highlighted there you should then be able to find the metric in Grafana by the first part of the line. In this case hwi_total_cpu_usage

1602182528656.png

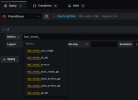
You can find it through the drop downs or as I later learned just start typing

1602182600775.png

The last trick for me so far was further specification. For example I have 2 hosts that both report Total CPU Usage as "hwi_usage" in the Prometheus data but if you start typing a { after (what I think is called) the metric name you can specify further refinement.

1602182719717.png

*EDIT

I left out an important part as mentioned earlier in the thread, I added


# Catch all
- '(?<MetricName>.*)'

Just above the -name: AggregateValues section of the Prometheusmapping.yaml file, the used the url in the readme to reset the internal caches (not sure if that last part was really needed)

@Kallex BRAVO! You've made this so very easy!
 
Last edited:
I left out an important part as mentioned earlier in the thread, I added


# Catch all
- '(?<MetricName>.*)'

Just above the -name: AggregateValues section of the Prometheusmapping.yaml file, the used the url in the readme to reset the internal caches (not sure if that last part was really needed)

Yeah to give some explanation for that last line... all the lines above, that you correctly saw, try to categorize/structurize the sensors like for different Cores and such; they take coreNo separate so one can aggregate and treat the values still in same sensor but different cores.

That last line is "catch all"; if some sensor matches anything above that line, the line that matches it, will handle it. Now if you get any sensors left, that didn't get matched to any more structurized "matching", that last line will catch the sensor completely almost entirely unstructured manner. It does add the other categories there still, and the "instance" comes out-of-the-box from Prometheus.

Anyway, there is no right or wrong way doing these things. As said, I try to add certain easier flexibility to the system, at least when WMI metrics kick in (as those are plenty and then some).

And again, thanks for thorough explanation for everyone else!
 
Thank you @Kallex ! This is superb. I registered to this forum to thank you for your great work.

I had a spare Raspberry Pi 3 B+ in an official Pi display case and wanted to make a nice PC health monitor out of it. My rig consists of AMD 3950x, RTX 2080 S and custom loop water cooling built on Gigabyte Aorus Master X570.

Although I had some experience of tweaking Grafana and a database feeding it, I must admit I found out that the learning curve to master both the magically indented syntax of YAML and ingenious regular expressions was too steep for me. I chose an easy path instead and used the "Catch all" method and did some housekeeping by disabling all unwanted sensor readings in the HWinfo Sensor view. Did some renaming too.

I'm still in expiremental phase of the limits of Pi 3B+. At the moment Prometheus is scraping every 4 seconds and Pi seems to cope well. Pi does struggle a bit with Chromium and I think it would be worthwile to upgrade to Pi 4 with more memory and put Chromium cache to tmpfs.

Here's a screenshot from my monitor in idle:
2020-10-15-190912_800x480_scrot.png

Cinebench R20:
2020-10-15-191027_800x480_scrot.png

Furmark:
2020-10-15-191602_800x480_scrot.png

Next thing in my todo-list is to make some sub-dashboards to deepdive into some areas, such as SMART information and voltages.
 
Actually the catch-all is not any kind of sin. The regexp-metric-categorizing is mostly beneficial in repeating parts, such as CPU Cores, where you can then pick "max" or "avg" or something like that over collection of things. Using Max I've actually seen my Ryzen 3950X reach 4.7k at least once! It never reaches that under any kind of load.

The system does add unit even to regexp-catch-all, so its not completely unknown data. I think I underlined too much the regexp, but when I made the reference, I wanted to get the categorizing etc done and it went a bit overboard.

Nice looking dashes and thanks for the feedback :).
Oh, I see! I was going to ask you how to get max values because I can only see the current values. I guess I have to humble myself and take a closer look at the regexp. Please don't take me wrong, I didn't mean to downplay your efforts and excellent work with the configuration. I'm just lazy and wanted quick results ;)

BTW, my 3950X reaches 4725 MHz on two cores occasionally but only for a fraction of a millisecond. I can only see it in HWinfo's Maximum column :)

No I didn't take you wrong, no worries. The regexs are pain in the ass also. I think you can go by "best of the both worlds"; I think they default regexps provided should already give you all the CPU parts OK. You can try to keep the "catch-all" as last line (before aggregated values)... or somewhere after the more detailed ones.

Or if you're already doing it, you can just do max() inside the Grafana. Max doesn't need to go into regexps in any other way, but to "extract" the coreNo in a manner so that you get all those resulting metrics named identical, but the coreNo-attribute separating them.

Example below; this should come out-of-the-box. After which you can do in Grafana (instance being the machine - out of the box from Prometheus): max(hwi_core_clock_mhz) by(instance)

Code:
# HELP hwi_core_clock_mhz Core Clock MHz - CPU [#0]: AMD Ryzen 9 3950X
hwi_core_clock_mhz{coreno="0",unit="MHz",sensor_type="SENSOR_TYPE_CLOCK",sensor="Core 0 Clock (perf #2/4)",source="CPU [#0]: AMD Ryzen 9 3950X"} 4200
hwi_core_clock_mhz{coreno="1",unit="MHz",sensor_type="SENSOR_TYPE_CLOCK",sensor="Core 1 Clock (perf #1/2)",source="CPU [#0]: AMD Ryzen 9 3950X"} 4175
hwi_core_clock_mhz{coreno="10",unit="MHz",sensor_type="SENSOR_TYPE_CLOCK",sensor="Core 10 Clock (perf #9/11)",source="CPU [#0]: AMD Ryzen 9 3950X"} 3600
hwi_core_clock_mhz{coreno="11",unit="MHz",sensor_type="SENSOR_TYPE_CLOCK",sensor="Core 11 Clock (perf #11/15)",source="CPU [#0]: AMD Ryzen 9 3950X"} 3340
hwi_core_clock_mhz{coreno="12",unit="MHz",sensor_type="SENSOR_TYPE_CLOCK",sensor="Core 12 Clock (perf #12/10)",source="CPU [#0]: AMD Ryzen 9 3950X"} 3340
hwi_core_clock_mhz{coreno="13",unit="MHz",sensor_type="SENSOR_TYPE_CLOCK",sensor="Core 13 Clock (perf #14/14)",source="CPU [#0]: AMD Ryzen 9 3950X"} 3360
hwi_core_clock_mhz{coreno="14",unit="MHz",sensor_type="SENSOR_TYPE_CLOCK",sensor="Core 14 Clock (perf #15/13)",source="CPU [#0]: AMD Ryzen 9 3950X"} 4175
hwi_core_clock_mhz{coreno="15",unit="MHz",sensor_type="SENSOR_TYPE_CLOCK",sensor="Core 15 Clock (perf #13/9)",source="CPU [#0]: AMD Ryzen 9 3950X"} 3340
hwi_core_clock_mhz{coreno="2",unit="MHz",sensor_type="SENSOR_TYPE_CLOCK",sensor="Core 2 Clock (perf #3/3)",source="CPU [#0]: AMD Ryzen 9 3950X"} 4200
hwi_core_clock_mhz{coreno="3",unit="MHz",sensor_type="SENSOR_TYPE_CLOCK",sensor="Core 3 Clock (perf #1/1)",source="CPU [#0]: AMD Ryzen 9 3950X"} 4200
hwi_core_clock_mhz{coreno="4",unit="MHz",sensor_type="SENSOR_TYPE_CLOCK",sensor="Core 4 Clock (perf #4/8)",source="CPU [#0]: AMD Ryzen 9 3950X"} 4200
hwi_core_clock_mhz{coreno="5",unit="MHz",sensor_type="SENSOR_TYPE_CLOCK",sensor="Core 5 Clock (perf #5/7)",source="CPU [#0]: AMD Ryzen 9 3950X"} 4175
hwi_core_clock_mhz{coreno="6",unit="MHz",sensor_type="SENSOR_TYPE_CLOCK",sensor="Core 6 Clock (perf #6/6)",source="CPU [#0]: AMD Ryzen 9 3950X"} 3360
hwi_core_clock_mhz{coreno="7",unit="MHz",sensor_type="SENSOR_TYPE_CLOCK",sensor="Core 7 Clock (perf #7/5)",source="CPU [#0]: AMD Ryzen 9 3950X"} 3600
hwi_core_clock_mhz{coreno="8",unit="MHz",sensor_type="SENSOR_TYPE_CLOCK",sensor="Core 8 Clock (perf #8/12)",source="CPU [#0]: AMD Ryzen 9 3950X"} 4200
hwi_core_clock_mhz{coreno="9",unit="MHz",sensor_type="SENSOR_TYPE_CLOCK",sensor="Core 9 Clock (perf #10/16)",source="CPU [#0]: AMD Ryzen 9 3950X"} 3600

Resulting to following (IP + port being the instance):
MaxCoreFrequency.png
 
No I didn't take you wrong, no worries. The regexs are pain in the ass also. I think you can go by "best of the both worlds"; I think they default regexps provided should already give you all the CPU parts OK. You can try to keep the "catch-all" as last line (before aggregated values)... or somewhere after the more detailed ones.

Or if you're already doing it, you can just do max() inside the Grafana. Max doesn't need to go into regexps in any other way, but to "extract" the coreNo in a manner so that you get all those resulting metrics named identical, but the coreNo-attribute separating them.
Ok, thank you, gotcha! I do have your default regex and catch-all after them as you instruct. I'll take a look at Grafana panel settings.
 
I am having a problem connecting to the PromDapter (0.9.16) from Grafana (7.3.6).
I have installed the Grafana to my Debian and it can access the metrics page OK, I have tested with "curl http://vault20:10445/metrics" and it returns the page with all the values.

But when I try to add Prometheus data source to Grafana it says "HTTP Error Not Found".
And outputs this to the syslog:

Dec 30 13:21:28 vault13 grafana-server[12331]: t=2020-12-30T13:21:28+0200 lvl=info msg="Request Completed" logger=context userId=1 orgId=1 uname=admin method=GET path=/api/datasources/proxy/6/api/v1/query status=404 remote_addr=192.168.13.135 time_ms=20 size=0 referer=http://vault13:3000/datasources/edit/6/

vault13 = Debian where the Grafana is running
vault20 (192.168.13.135) = Windows where PromDapter and HWiNFO64 are running.

It seems to be trying to get path "/api/datasources/proxy/6/api/v1/query", that doesn't exists under http://vault20:10445/metrics.
What should I do?

You also need to install Prometheus; that's the missing piece in your puzzle. PromDapter is servicing data to Prometheus scrapers; so that the data gets stored in Prometheus database. Then Grafana connects the Prometheus normally and can use the data.

PromDapter is short for "Prometheus Adapter", meaning it provides data for Prometheus. It's not trying to bypass Prometheus or "serve as Prometheus towards Grafana".

It should be straightforward to add in your installation; then within Prometheus you should be able to configure and confirm that the scraping works.... and Grafana again should see your Prometheus normally (I'm not sure if there are any/some standard Prometheus-specific stats immediatelly to use without scraping anything).
 
Back
Top