HWiNFO64 CPU Die (Average) Spike?

Venoxium

New Member
As you can see from the image below, I had HWiNFO64 open and minimized to tray for a while. Wasn't playing games or anything but when I opened it back up it showed that the Maximum CPU Die (Average) was 104.2c. How could this be possible? As you can see from my other temps from the sensors, everything appears to be fine. Is this a bug or?
HWINFO.PNG
 
Last edited:
It could be a bug in CPU/SMU reporting or a collision with some other software. Are you maybe running some other monitoring or overclocking tools too?
 
It could be a bug in CPU/SMU reporting or a collision with some other software. Are you maybe running some other monitoring or overclocking tools too?
I do have MSI Afterburner in the background but besides that there are no more software open. Only other thing that is open during this is a fan controller app.
 
It would be great if you could catch this erratic readout in the HWiNFO Debug File (while running in Debug Mode) so I could analyze why this happens.
 
I noticed my CPU was momentarily at 111 Degrees and I noticed the voltages for CPU VDDCR_VDD Voltage, CPU VDDCR_SOC Voltage, and CPU VDD_MISC Voltage ran at 2 volts. Running a 7800X3D on an Asus ROG Strix X670E-F motherboard with the 1410 Beta BIOS. All settings are stock. Is this a bug? My CPU's still alive.

Screenshot 2023-05-04 135248.png
CPU SOC never went above 1.048 so there could be a discrepancy.
Screenshot 2023-05-04 134850.png
 
I'd say this is a wrong readout but it looks quite suspicious. So I have submitted this to my AMD contacts and they are checking it. Waiting for their response...
 
Hello!

I noticed that the maximum cpu die temperature is very high, but I don't know when it happens. In the last case, no software with higher power requirements was running. I didn't even hear the cpu heat. The other sensors measured much lower temperatures. I don't understand. SVI TFN marked readings were outstandingly high. It was about exactly double everything at that point. It is as if the program stacked the real values. It didn't even add it to the average.
Motherboard: Asus x670e-e strix
I use expo tweaked profile, nothing else


Thanks for the help!
 

Attachments

  • 32131321.PNG
    32131321.PNG
    104.2 KB · Views: 45
Thank you. AMD requested this information so they can analyze and understand what's going on...
 
Had the same issue, on a 7950x3D, also an Asus motherboard (TUF Gaming x670e plus wifi, on the latest bios-1616). It happened twice while I was playing a quite light game, also the core power in a different case went to 800-900W per core). The second scenario I can reproduce easily and I have reproduced it with HWiNFO64 alongside another software and the other software had normal values.
 

Attachments

  • 1684776238445.png
    1684776238445.png
    102.1 KB · Views: 43
Just had this happen to me too. Basically spiked to 126 degrees on the die (also on the latest Bios).
7800X3D on PRIME X670-P WIFI
 
Just had this happen to me too. Basically spiked to 126 degrees on the die (also on the latest Bios).
7800X3D on PRIME X670-P WIFI

A screenshot also showing voltages like above would be helpful.
Also, do you know when that happened? Would be interesting to know if it happened during normal use or after a system suspend/resume perhaps.
 
A screenshot also showing voltages like above would be helpful.
Also, do you know when that happened? Would be interesting to know if it happened during normal use or after a system suspend/resume perhaps.
Will try to replicate it. I was in the middle of playing an MMO and saw it. Didn’t save the logs or took a screenshot. It might likely be when I was pushing it with max settings with a full map (was down to 25-30 fps).

Will try again tomorrow.
 
I have attached the logs from HWiNFO and AMD Adrenalin Logging as well as screenshots of HWiNFO and HWMonitor.
In both log files I can see a spike to 2+ volt for a brief moment.

The spike could very likely be when I load to a new map or when I remove the frame limiter from AMD Adrenaline (I was limiting it to 100FPS then I removed it causing a spike to 180+ FPS). I then joined a more populated map that dropped my FPS to 50-60FPS.

EDIT: Looks like I can only attach one file at a time (so I zipped them up)

EDIT 2: Interesting that the temps spikes this much and drops right away. Is that possible for all of this to be in a few seconds window?
64.41.24
122.12.48
641.24
 

Attachments

  • 05-24-2023 Logs.zip
    230.3 KB · Views: 5
Last edited:
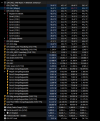
This is going to be a little long, I apologize. Since the exploding Ryzen CPU issue popped up recently, I've been watching my voltages like a hawk. I've noticed that every once in a while (perhaps once a day?) there is a momentary spike in three values: VDDCR_SOC, VDDCR_VDD and CPU Die (average). They all happen at exactly the same time, and tend to exceed safe values. The temp doesn't always (I've seen it hit 110 C, but sometimes it's only 70 or 80). The safe SOC voltage is 1.3 V, and it always goes well beyond that, generally 1.5, 1.6, 1.8 or even 2+. A key finding that I think is suspicious is that the average die temp spikes, but no other temperature value in the whole computer does. I suppose it could be the memory controller which maybe doesn't have a dedicated sensor, so it only shows up in the average. I'm deeply alarmed, and I'm hoping someone can help. If it was one value, I might not be so concerned, but considering all three are spiking at precisely the same time, I can't imagine it's not a real problem.

I have wondered if this is a sensor glitch, or a quirk of the way data is parsed by HWinfo, or if it's a real event that's going to damage things. I thought that turning on DOCP/EXPO profiles might be causing it, but it just happened and I have DOCP turned off. I'm having a tough time establishing a pattern because it's so infrequent. I don't think I can use logging to get more detail, because I'd have to be logging for many hours or days. I'm going to try turning off PBO next, and waiting until I see it. I'm hoping this isn't a problem with AGESA, the Asus BIOS or a physical voltage regulator.

I've been told not to worry about it, that if it was real, it would immediately destroy the CPU. I'm not convinced, so I'm continuing my efforts to figure things out. I have alerts set 05292023.PNGon these values, so that'll hopefully help me. I have noticed one thing: the last two times it happened, it seemed to be responding to user input. The first time, I was in another application (maybe watching Netflix), and I switched to HWinfo, which immediately showed the spikes. The second time was just a few minutes ago, when I clicked on my remote desktop (I'm accessing my machine from work), as soon as clicked on the window the spikes/alerts appeared. Could it be that the processor is over-responding to a sudden user input, and is ramping up voltages too fast in an effort to respond?

I could use any help anyone is willing to provide, but I think I have two major questions initially:

1. Is this likely to be a real event, or is it HWinfo just displaying erroneous values?
2. If it is real, is it likely to cause damage, or is it ok because it's so short-lived?

Thanks very much in advance for any feedback.
 
Same here. All seems to be pretty much fine except this 110c CPU Die (average) spike
 

Attachments

  • Snap 2023-05-29 at 15.05.34.jpg
    Snap 2023-05-29 at 15.05.34.jpg
    400.6 KB · Views: 41
Back
Top