HWiNFO64 CPU Die (Average) Spike?

Just had it spike for 1 sec while watching Twitch and just in gaming crafting items (GW2). FPS locked at 75 and in a map that's just running at 75 FPS. So didn't really had to do with a spike. I was crafting and idling in the map for a good 30 mins and I got a warning popup (i set alerts).
It spiked to 127 degrees with 2.48v
1686194559615.png
 
I also am having similar high temperature spikes and VDDR SOC voltages.

System specifications are
CPU: 7950X
RAM: 2 x 32GB Kingston Fury 5600 1.25V
CPU Cooler: Thermalright Peerless Assassin
Motherboard: Gigabyte B650M Aorus Elite Wifi, BIOS F5 using AMD AGESA 1.0.0.6
GPU: RTX 4090
Windows 10 pro OS

HWinfo v7.46-5110

Motherboard settings: 105W eco mode, -100mhz max PBO boost, Curve optimizer -10 all cores, manual setting for RAM and SOC to 1.125V manually.

Applications running in the background in most if not all cases: Process Lasso with steam and other gaming using first CCD only and chrome/discord using 2nd CCD, Fan Control, MSI Afterburner, Radeon Drivers, Nvidia Settings, Google Drive, TightVNC Services, and Discord. Also usually have chrome open and OBS.

I've also tried having HWMonitor running alongside HWinfo, and found that the VDDR_SOC never got to this 2.4V that HWinfo got, nor does it ever see those above 100 C temperatures on the CPU die (average) though not sure it just doesn't have that value shown.
 

Attachments

  • 7950X.png
    7950X.png
    188.1 KB · Views: 22
  • 7950x+hwmonitor.PNG
    7950x+hwmonitor.PNG
    245.3 KB · Views: 21
Last edited:
Hi All - Yes, we are looking at this in the lab now. I'll get a few more systems running. So far, running various mixed workloads, we haven't reproduced it. Take care!
If the labs are in the San Jose/ Santa Clara area AMD HQ, what if I bring my system in? :D /s
 
I also am having similar high temperature spikes and VDDR SOC voltages.

System specifications are
CPU: 7950X
RAM: 2 x 32GB Kingston Fury 5600 1.25V
CPU Cooler: Thermalright Peerless Assassin
Motherboard: Gigabyte B650M Aorus Elite Wifi, BIOS F5 using AMD AGESA 1.0.0.6
GPU: RTX 4090
Windows 10 pro OS

HWinfo v7.46-5110

Motherboard settings: 105W eco mode, -100mhz max PBO boost, Curve optimizer -10 all cores, manual setting for RAM and SOC to 1.125V manually.

Applications running in the background in most if not all cases: Process Lasso, steam and other gaming using first CCD, Fan Control, MSI Afterburner, Radeon Drivers, Nvidia Settings, Google Drive, TightVNC Services, and Discord. Also usually have chrome open and OBS.

I've also tried having HWMonitor running alongside HWinfo, and found that the VDDR_SOC never got to this 2.4V that HWinfo got, nor does it ever see those above 100 C temperatures on the CPU die (average) though not sure it just doesn't have that value shown.

Hmm, this would be the first non-ASUS report of this behavior. HWMonitor most probably doesn't read sensors from the same source as HWiNFO.
 
Hmm, this would be the first non-ASUS report of this behavior. HWMonitor most probably doesn't read sensors from the same source as HWiNFO.
In my first picture, the VDDCR_SOC Voltage values under the CPU is reporting up to 2.4V max which is different from the CPU VCORE SoC under the Gigabyte motherboard section at 1.188V. Are these different sensors for the same thing or different values for different things entirely?
 
If the labs are in the San Jose/ Santa Clara area AMD HQ, what if I bring my system in? :D /s
:) Austin, TX. Sorry!

I've been running those systems since I posted, and still no repro of the issue on my side. I was hoping to repro, because I was also logging the VRM telemetry externally with an EVC2 in parallel. We looked at the logs attached on the first page of this thread, and maybe you all saw this, but one thing to notice is that at the time of the high readings, the SMU requested voltage is half of that value - this seems to also correlate with the observation of @Trashcanclippy in post #45. We are still investigating it and in discussion with partners. The good news is that if the CPU really received 2.4V without liquid helium, it would die too fast to log anything in HWINFO64 :cool:
 
Just found this thread after randomly peeking at my hwinfo and noticing the scary numbers. Chiming in, another gigabyte board:

CPU: 7950X3D
RAM: 2 x 16GB TFroce vulcan 5600
CPU Cooler: EVGA CLC360mm AIO
Motherboard: Gigabyte X670 Aorus Elite AX
GPU: RTX 3080
Windows 10 pro OS


1686329629529.png
 
Hello again,

just played D4 for like 2 hrs and core frequencies, temps and VDD (this is new) went wild. SOC was fine however :D

1686504401656.png
1686504448689.png
Hope you can cope with the german terms. Ask away if you don't.
 
Hello again,

just played D4 for like 2 hrs and core frequencies, temps and VDD (this is new) went wild. SOC was fine however :D

View attachment 9417
View attachment 9418
Hope you can cope with the german terms. Ask away if you don't.

This seems to be a different issue. Are you perhaps running some other monitoring/tweaking tools along with HWiNFO?
It would be great if you could catch such situation while running in Debug Mode and then attach the HWiNFO Debug File.
 
Trying debug the next time. AMD Adrenalin was also running when this occurred. I aggree, this must be something else. Also, when I restarted HWiNFO, some CPU related sensors where missing.
 
Hi All - Yes, we are looking at this in the lab now. I'll get a few more systems running. So far, running various mixed workloads, we haven't reproduced it. Take care!
I was thinking of letting someone remotely connect to my machine (though I'd rather not). Is there any testing I can do? If you can show me how to measure the voltage on the board with a multimeter or oscilloscope, I could see if it's actually spiking. I can reproduce the problem at will, but not all the time. I'd love to show someone what's happening, and perhaps collaborate to do some testing. I know my system has the issue, so you could eliminate the step of trying to reproduce it. It's really just a matter of when it'll happen.
 
I was thinking of letting someone remotely connect to my machine (though I'd rather not). Is there any testing I can do? If you can show me how to measure the voltage on the board with a multimeter or oscilloscope, I could see if it's actually spiking. I can reproduce the problem at will, but not all the time. I'd love to show someone what's happening, and perhaps collaborate to do some testing. I know my system has the issue, so you could eliminate the step of trying to reproduce it. It's really just a matter of when it'll happen.
How are you reliably reproducing it? And what is your HW/BIOS config? I still haven't observed it in my lab. We did discuss with one of the mobo partners, but now I guess this is observed on others. Thanks in advance
 
How are you reliably reproducing it? And what is your HW/BIOS config? I still haven't observed it in my lab. We did discuss with one of the mobo partners, but now I guess this is observed on others. Thanks in advance
I'll describe how I reproduce it: I'm remotely connected to my desktop (using Chrome remote desktop) from another location. I'm doing whatever on the machine, and then I stop interacting with the remote window. Since I noticed this, I make sure to leave HWinfo on top and minimize the window. I wait for several minutes (anywhere between 10 minutes and an hour or more). When I click on the remote window again, the alert window pops up, and the spike appears on the graph.

This doesn't happen every time (sometimes 30%, sometimes 90% of the time in a given day), and it even happens sometimes while I'm using the machine, but this is the only way I've found to reproduce it any way but randomly. It doesn't have to be a remote desktop session, if I get up to do something else and come back to the machine when I'm home, it can happen too, as soon as I move the mouse.

It seems to me like there's something waking from a sleep state perhaps, and requesting power, which then causes the VRM to generate a spike? I just don't understand enough about how it works to theorize any more than that.

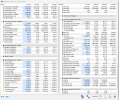
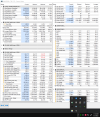
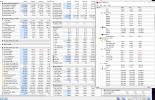
The one thing that makes me think it's a real spike, and not some data or sensor error is that there's a spike in average die temperature at exactly the same time. The really odd thing is that none of the temperature sensors report a spike, only the average die temp. It's almost like there's a sensor HWinfo can't see, but the average value takes into account.

If anyone wants to talk about it, I'd be happy to connect with them.

It seems that ASUS can't duplicate it in their lab either. I'm hoping that doesn't mean they're just going to leave me to swing.

I'm even thinking about buying an oscilloscope with logging to see if I can measure the values directly, I just don't know exactly where to probe. I've ordered a board from another manufacturer, I'll see if that fixes the problem.

My BIOS is the latest (1416), and I currently have on board video disabled, PBO CPB and DOCP enabled. I've tried turning each option off in different combinations, none of which stopped it from happening. Those are the only non-default settings I have.

Here's my hardware config:
CPU: 7950X3D
Motherboard: Rog Strix X670E-E gaming
Memory: 64 GB G.Skill F5-5600J2834F32GX2-TZ5RS (2 DIMM, on the QVL)
GPU: Zotac 3080 Ti Trinity OC
HDD: WD Black SN850 2TB, Sabrent Rocket 4.0 1TB, Seagate 3TB SATA, WD 4TB SATA
PSU: Corsair HX1000
OS: Windows 10 Home 22H2
Cooling: Custom liquid loop, 6 x fan, 1 x D5 pump.
 
Last edited:
I just noticed that I've had a similar spike today, but I have no idea when.

I've had AMD Adrenalin, Discord, Logitech G-Hub, ShareX, Gigabyte Control Center, PowerToys, Steam, Battle.net, RGBFusion, and Firefox running the entire session.
I was also in a Zoom call for a few hours and played Diablo 4 today.

System Specs:
CPU: AMD Ryzen 7 7800X3D
GPU: MERC 310 AMD 7900 XTX
Cooler: Thermalright Peerless Assassin
MOBO: Gigabyte B650 Aorus Elite AX
RAM: G.SKILL Trident Z5 RGB Series 32GB DDR5 6000

ipxnx3z.png
 
Last edited:
ASUS has told me they can't duplicate my problem in their lab, and it looks like they're washing their hands of it. They've told me AMD is investigating and I should contact them, but when I tried, they just told me to update my BIOS, which is the first thing I did weeks ago. Can anyone put me in contact with the relevant person(s) at AMD so I don't have to waste time explaining the whole thing to another group of support techs?

I'd love to be able to talk to the person doing the investigation, and let them know I can often reproduce it at will, and maybe divulge all the information I've collected.
 
Last edited:
Just had this happen to me too. Basically spiked to 126 degrees on the die (also on the latest Bios).
7800X3D on PRIME X670-P WIFI
I had exactly the same thing on my 7800X3D Aorus B650 Elite AX. Screenshot attached. Anyone find a solution/answer to this?
Btw, this is the second time this has happened. Same temperature last time: 126C
 

Attachments

  • Screenshot_2.png
    Screenshot_2.png
    174.8 KB · Views: 13
So we're getting more reports also from GIGABYTE boards.. One thing that seems to be common in all cases is that the SOC and MISC voltages are exactly double of normal values, VDD/Vcore in a similar range too. Maybe that gives some clue to AMD?
 
So we're getting more reports also from GIGABYTE boards.. One thing that seems to be common in all cases is that the SOC and MISC voltages are exactly double of normal values, VDD/Vcore in a similar range too. Maybe that gives some clue to AMD?
Martin, I just sent a writeup about this to AMD and included this thread. I did not notice the extreme spike in SOC and VDD. I wish I read this before submitting my ticket. However, it will be in my screenshot, so maybe they will notice.
 
Back
Top