There's no solution yet. AMD is investigating, ASUS seems to have given up. I would submit a support ticket to AMD and/or Gigabyte, the more complaints they get, the better the chances of a solution. A common theory is that it's a sensor problem, but that temperature spike at the same time makes me doubt that possibility. I've bought an MSI board and will be swapping it this weekend to see if the problem disappears.I had exactly the same thing on my 7800X3D Aorus B650 Elite AX. Screenshot attached. Anyone find a solution/answer to this?
Btw, this is the second time this has happened. Same temperature last time: 126C
You are using an out of date browser. It may not display this or other websites correctly.
You should upgrade or use an alternative browser.
You should upgrade or use an alternative browser.
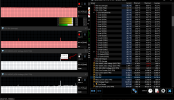
HWiNFO64 CPU Die (Average) Spike?
- Thread starter Venoxium
- Start date
EntropyDDS
Member
I'm not sure if this is helpful, and it's very anecdotal, but I put my computer to sleep when I'm not using it, and both times that this has happened, I don't recall there being a red number before putting the computer to sleep, and both times, I remember immediately seeing the spike after the computer exits sleep mode (windows 11).
This is an observation I've made as well. The difference is, I don't allow my machine to sleep, I've tried turning off every power saving feature I can find, but it still happens.I'm not sure if this is helpful, and it's very anecdotal, but I put my computer to sleep when I'm not using it, and both times that this has happened, I don't recall there being a red number before putting the computer to sleep, and both times, I remember immediately seeing the spike after the computer exits sleep mode (windows 11)
I can often reproduce it by leaving the machine alone for a few minutes, and then the issue pops up as soon as I move the mouse. My suspicion is that something is being put in a low power state, like a CPU core or memory controller, something Windows doesn't necessarily control. When you provide an input, it wakes up and somehow causes a spike. It could be that it demands power and the VRM responds rapidly, but can't react fast enough to prevent a short-lived spike.
What I currently do as an experiment is intentionally leave HWinfo on top, leave the machine for a while (10-60 minutes) and then come back and move the mouse or click on something. I'd say it happens at least 50% of the time on average. I then reset the sensor values in HWinfo, and repeat. I have a funny feeling this is caused by the BIOS logic, or maybe even the AGESA libraries it's wrapped around.
Also, I've noticed that when I see the spikes, the timestamp on the graph is often missing time. It will jump by a number of minutes. If you hover your cursor over the graph, it shows the time that value was recorded. If you check just before the spike, you might get something like 9:00 am, and immediately after the spike, it might say 9:25 am, as if something stopped reporting for 25 minutes. This doesn't happen every time, but often enough to notice. Check out these screenshots to see what I'm talking about. This is the same spike, just two different views, one showing the time before the spike (17:17) and the other immediately after (17:52).
Attachments

I've had a look at that, it does seem to be double in some cases, but not all. My SoC voltage usually sits around 1.045 V, and the highest value I see is 2.090, exactly double. But I often see 1.565 V, and my SoC voltage is never half that. 1.565 is very close to 1.5 times 1.045 though. It's definitely an intriguing event, maybe there's some sort of multiplier that gets set to 1.5 or 2 somewhere.So we're getting more reports also from GIGABYTE boards.. One thing that seems to be common in all cases is that the SOC and MISC voltages are exactly double of normal values, VDD/Vcore in a similar range too. Maybe that gives some clue to AMD?
EntropyDDS
Member
Hmmm, reporting (CPU to MOBO) issue the likely culprit?I'm noticing some new behaviour I haven't seen before: sometimes I only get a VDD and average temp spike, but no SoC spike. I'm also seeing situations where all my core temps have a 0 minimum value. Just more puzzling stuff.
It could very well be. I just don't have the expertise or equipment to find out for sure.Hmmm, reporting (CPU to MOBO) issue the likely culprit?

Yeah, that certainly seems about right.Yep, observed it again today. Usual spikes on die avg temp (101,6 °C) and SOC. Didn't activate debug ofc
As for the "SOC is doubled" observation: May be true. My SOC min is at 1.240V, avg is at 1.243V and the spike today was at 2.480V.
Did you know that you can set alerts in HWinfo, so it will pop a dialogue window when a certain value is exceeded? I find it super useful for keeping track of it.
EntropyDDS
Member
Got a response from AMD today. They told me to update my BIOS (this was done before the issues occurred)
Running bios Version 1618 on my Asus X670E-Pro WIFI. The observation is that whenever I get the alert, it doubles the metrics for 1-2 seconds, basically between polls it doubles when it does happen. It happens very randomly. Usually is when I'm playing Guild Wars 2 and have Twitch in the background. I have had it happen when I'm playing on a highly populated map or just on a map where I'm crafting for prolonged periods. There are gaming sessions where this isn't ever a problem. So far I've had it happen 3 times and each time is just 1-2 seconds of it reporting that. It's not just HWiNFO, AMD logging shows it too. I usually spend 3-4 hours with the game open when it happens. So definitely not something to easily reproduce. Keep in mind that GW2, with max settings and a decently populated map, will bring my FPS down to like 30-40 FPS. I ran some synthetic benchmark stuff before and I never triggered it.
Yeah, it's up to you. You're right that it would've already happened, I use them for gathering evidence. If my CPU happens to explode, I want lots of documentation to show it was a recurring problem. Just making sure you knew about it.Yes I know about this feature. However, I don't see the point here? I do not want to be bothered by popups when gaming and activating debug in case of such a pop up would be too late wouldn't it?
They told me the same thing. I explained that was the first thing I did weeks ago, and told them about the whole rigmarole I went through with ASUS. They came back and asked for detailed information, so that's better than what I was expecting.Got a response from AMD today. They told me to update my BIOS (this was done before the issues occurred)
Very interesting. What are you referring to when you talk about AMD logging? Ryzen master, or is there something I'm not aware of? I haven't been able to find anything besides HWinfo that monitors SoC voltage.Running bios Version 1618 on my Asus X670E-Pro WIFI. The observation is that whenever I get the alert, it doubles the metrics for 1-2 seconds, basically between polls it doubles when it does happen. It happens very randomly. Usually is when I'm playing Guild Wars 2 and have Twitch in the background. I have had it happen when I'm playing on a highly populated map or just on a map where I'm crafting for prolonged periods. There are gaming sessions where this isn't ever a problem. So far I've had it happen 3 times and each time is just 1-2 seconds of it reporting that. It's not just HWiNFO, AMD logging shows it too. I usually spend 3-4 hours with the game open when it happens. So definitely not something to easily reproduce. Keep in mind that GW2, with max settings and a decently populated map, will bring my FPS down to like 30-40 FPS. I ran some synthetic benchmark stuff before and I never triggered it.
I'm saving a screenshot of each time it happens, and I hover over the SoC graph so it displays to tool tip showing the high value. Tell me one thing, on the graph, is there a time gap just before and after the spike? Does it jump from 7:45 to 7:51 or similar?
Trashcanclippy
Member
I'm still getting the 2.4V on the SOC and CPU Die (average) temps spiking way above 100C, so no change on my end. So a friend sent me this video by Gigabyte Aorus, and was interesting to see that perhaps the CPU reporting in HWiNFO is not so accurate.

I was using AMD Adrenalin to log at some point. I stopped running long logs. I been just letting HWiNFO alert me when it happens.Very interesting. What are you referring to when you talk about AMD logging? Ryzen master, or is there something I'm not aware of? I haven't been able to find anything besides HWinfo that monitors SoC voltage.
I'm saving a screenshot of each time it happens, and I hover over the SoC graph so it displays to tool tip showing the high value. Tell me one thing, on the graph, is there a time gap just before and after the spike? Does it jump from 7:45 to 7:51 or similar?
What I notice is that everytime i get an alert and I check the temps, it only last for 1 second. It literally doubles the metric and comes back down the next second. These have been my alerts:
7.6.2023,20:19:18.608,CPU Die (average),126.8 °C
7.6.2023,20:19:26.933,CPU VDDCR_SOC Voltage (SVI3 TFN),2.480 V
21.6.2023,16:49:3.133,CPU Die (average),108.7 °C
21.6.2023,16:49:4.917,CPU VDDCR_SOC Voltage (SVI3 TFN),2.480 V
23.6.2023,22:31:17.240,CPU Die (average),122.9 °C
23.6.2023,22:31:19.463,CPU VDDCR_SOC Voltage (SVI3 TFN),2.480 V
I'm not sure if that's the same as a debug log, I still haven't figured out exactly what people are referring to.Well today temps have been normal but SOC spiked to 1.863. I also happen to have a log of this session (is this the same as a debug log?)
View attachment 9471
What I find compelling is that your voltages are much higher than mine, and so are the temperatures. I can see this being a fault with the data coming from the CPU (everything is that much higher across the board), or a genuine reading where the higher voltage generates higher temps. It's getting really frustrating.I was using AMD Adrenalin to log at some point. I stopped running long logs. I been just letting HWiNFO alert me when it happens.
What I notice is that everytime i get an alert and I check the temps, it only last for 1 second. It literally doubles the metric and comes back down the next second. These have been my alerts:
7.6.2023,20:19:18.608,CPU Die (average),126.8 °C
7.6.2023,20:19:26.933,CPU VDDCR_SOC Voltage (SVI3 TFN),2.480 V
21.6.2023,16:49:3.133,CPU Die (average),108.7 °C
21.6.2023,16:49:4.917,CPU VDDCR_SOC Voltage (SVI3 TFN),2.480 V
23.6.2023,22:31:17.240,CPU Die (average),122.9 °C
23.6.2023,22:31:19.463,CPU VDDCR_SOC Voltage (SVI3 TFN),2.480 V
Similar threads
- Replies
- 1
- Views
- 108
- Replies
- 2
- Views
- 2K
- Replies
- 12
- Views
- 7K