Nonsense min and max CPU core temperature values on system tray icons

Dave-H

Well-Known Member
Hi, I'm using HWiNFO 7.00 on my dual boot machine, both 64 bit (on Windows 10) and 32 bit (on Windows XP).
On both of them, and on previous versions of HWiNFO too, although the CPU temperature on both processors of my dual processor machine is apparently being recorded correctly, the reported minimum and maximum temperatures on the system tray icons' pop-ups are complete nonsense. The processors are Intel X5460 Xeons.
For instance, as I type, using the 64 bit version on Windows 10, the temperature of CPU1 is shown as 71.0°C, but the minimum is 1.0°C and the maximum 252.0°C!
Likewise on CPU2, the running temperature is 72.0°C. the minimum 2.3°C and the maximum 157.0°C!
So, the running temperatures are presumably correct, but the min and max values are absolute rubbish!
This has always been the case since I started using HWiNFO, which is great in every other respect, but any idea why these min and max readings are so wrong?
Thanks, Dave.
:)
 
Thanks Martin, but CoreTemp shows quite normal looking values for those parameters!
As I said, the running temperature values are being shown correctly as far as I can tell, at least they pretty much agree with what's shown by CoreTemp and Speccy.
It's just the displayed min and max values which are completely wrong.
Surely if the "live" values are correct, the min and max values should be as well, as they're just showing the two extremes of the live values for that session?
The parameters I'm monitoring incidentally are "CPU1" and "CPU2" in the "Winbond/Nuvoton W83793" section of the System Tray parameters.
That is the parameter than gives live temperatures closest to CoreTemp and Speccy.
Cheers, Dave.
:)
 
Ah, I thought you're referring to the DTS sensor values. The W83793 sensor is different (most other tools don't monitoring this sensor) and such Min/Max values indicate that the sensor occasionally provides erratic data. This is most likely happening only quite rare, so it's not observable during run time via current values, but the glitch is captured as the Min/Max value observed.
 
So this isn't a problem with HWiNFO?
I assumed that it was HWiNFO which recorded the min and max values based on the running live value.
As I said, the live value seems correct, but the min and max values aren't just a bit wrong, they're complete nonsense!
So, if those values aren't being generated by HWiNFO, and are actually coming from the sensor, which options would you recommend that I use on the system tray icons to get the best readings? I did try the other temperature options in the list when I initially set up HWiNFO, but all the others seemed to give live temperature values that were signigicantly different from what CoreTemp and Speccy were showing.
:)
 
CoreTemp is showing the DTS values only, the same are shown in HWiNFO.
But since the Tj,max value cannot be determined for these early CPU series (per the article I posted above), there can be a discrepancy between the tools if they believe in a different Tj,max for a given CPU model. This can be adjusted in HWiNFO - right-click on the core temperature value and select "Adjust Tj,max".
 
The Tj,max for my processors is actually 100°C, which is recognized by CoreTemp, but I guess it's in its database if it can't read it from the processor itself.
I wasn't aware that you could set it manually in HWiNFO, I will try back and report if it makes any difference to the min and max temperature readings.
Thanks, Dave.
:)
 
OK, I've updated the Tj,max setting in HWiNFO.
It was set to 85°C, it's now 100°C for both processors.
This hasn't made any difference to the problem, but I'm not sure why it would have done.
I've done some closer checking, and it seems as if the min and max temperatures recorded are reasonable for a while when the machine first boots up, but then after a while they go to nonsense readings, as you can see on the image below.

SensorsWinXP.jpg

If this set of sensors is unreliable, I would of course rather use a different set, but I could see no other place where it's possible to have an overall, presumably average, reading of the temperature of all of the cores. All the rest will only give me the temperature of one core at a time in the system tray icon, and I don't want to have multiple icons.
CoreTemp is not good in that respect either, as you can only have the temperature of the hottest core displayed on a single icon, not an average of them all, which is what Speccy shows. Is there any answer to this?
:)
 
Are you perhaps running some other monitoring tool with HWiNFO? That could be causing a conflict and resulting in such invalid values being read from the Nuvoton sensors.
Core temperatures don't vary that much, so you could use one of them for reference.
The next HWiNFO Beta build will (among many others) bring also an average core temperature ;)
 
No, I'm not running any other monitoring utilities.
I have a triple boot machine, with Windows 10 x64, Windows XP x86, and Windows 98SE!
This problem shows on all of them.
That's really good news that there will be an option on a future version to show the average core temperature on a processor, I can then use a different sensor option which hopefully won't show the issue. Is there any timescale on this? I would be very happy to test a beta version when it's available.
Cheers, Dave.
:)
 
That's great!
Do I need to register to get notified of beta versions? I don't get offered them normally and I can't see a setting to enable that.
Perhaps you could just put a download link here?
:)
 
Sorry, I've looked again and I still can't see anywhere in the settings to enable notifications about beta versions.
It is certainly possible that I did disable it if it was there on an update notification pop-up, but have you then got to wait for the next update before you can enable it again?

Incidentally, and off-topic, did notice something else odd when I was going over the settings.
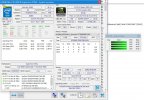
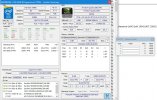
Looking at the System Summary screen, the entry "CPU Status" only appears to be there for one of my CPUs, not the other, as you can see.
It's missing in other places as well. As I've no reason to think that CPU#1 isn't working normally, this is puzzling me!
Is that normal? The "Active Clock" window also shows no data for CPU#1, which it does for CPU#0.
It shows the same on Windows XP and Windows 10, obviously Windows 98 can only see one CPU (and one core) anyway!
:)

Screenshot 26.jpg

Screenshot 27.jpg
 
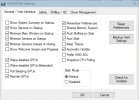
On main settings "General / User Interface" there is a button down right "Check for updates". You will see the checked/unchecked boxes there.
If sensor window starts on auto and you dont have access to main settings at start, then right click the HWiNFO tray icon >> Settings
 
Please attach the HWiNFO Debug File, I need to see more details why it doesn't show clock for CPU1.
 
No checkboxes relating to updates that I can see I'm afraid Martin.
If I click the button it just tells me that there's no updates.

Screenshot 28.jpg

By a debug file I assume you mean a report.
I've generated it in HTML with all options checked.
Hope this helps!
 

Attachments

  • AshfieldCourt.htm
    245.1 KB · Views: 0
For debug file:
 
Come on man... hit that "Check for Updates" button... I already said that!
So should I be seeing something else if I hit the "Check for Updates" button?
All that happens for me is that a window briefly pops up saying no updates are available.
Thanks for the info about generating the debug file.
:)
 
Back
Top