You are using an out of date browser. It may not display this or other websites correctly.
You should upgrade or use an alternative browser.
You should upgrade or use an alternative browser.
Prometheus Adapter for HWiNFO (+ Grafana Dashboard)
- Thread starter Kallex
- Start date
Is it possible for me to add CPU temperature to the exporter? I'm not so sure where to look in the code to add support for CPU (I take it I have to manually add it and then compile the code?).
It should be just a matter of proper regexp pattern on C:\ProgramData\PromDapter\Prometheusmapping.yaml
If you post the exact name of the sensor in HWiNFO, I can help you modify the regexp pattern to match it.
It should be just a matter of proper regexp pattern on C:\ProgramData\PromDapter\Prometheusmapping.yaml
If you post the exact name of the sensor in HWiNFO, I can help you modify the regexp pattern to match it.
Thank you for the quick response!
How do I get the exact name of the sensor in HWiNFO?
EDIT: this is what I see in HWiNFO
EDIT2: found it
 - "(?<Entity>CPU) (?<MetricName>Temperature)"
Last edited:
Thank you for the quick response!
How do I get the exact name of the sensor in HWiNFO?
EDIT: this is what I see in HWiNFO
View attachment 5873
EDIT2: found it
Yes that seems correct; did you add that one yourself? I didn't see it in mine, but my CPU has the sensor bit different named.
So it should already appear in exporter; that is in the list: http://localhost:10445/metrics
So it's working as you wanted now, hopefully..?
")
I indeed added that one myself, restated the service and now it logs perfectly. Now that I know how I can add more entries to the logger, I can probably replace my old wmi exporter with this oneYes that seems correct; did you add that one yourself? I didn't see it in mine, but my CPU has the sensor bit different named.
So it should already appear in exporter; that is in the list: http://localhost:10445/metrics
So it's working as you wanted now, hopefully..?
! Much more data is available from HWiNFO than from wmi. Thank you a lot for your help!I indeed added that one myself, restated the service and now it logs perfectly. Now that I know how I can add more entries to the logger, I can probably replace my old wmi exporter with this one
Oh I am over halfway of adding WMI data to PromDapter too, just got occupied elsewhere a bit - so its been "delayed" for now. I wanted it myself for monitoring process specific stuff (what's hogging RAM etc).
What are you looking to get from WMI specifically?
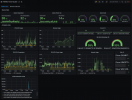
To answer my own question yes, it is possible to get network stats. IO wait isn't available but disk writes and reads are all there which is enough for me, now to create a complete grafana board!
EDIT: Here is my WIP board. The hostname I filled in by hand now, unfortunately there isn't a sensor in HWiNFO telling the name, any idea of a better way to monitor that so it might be possible to monitor multiple systems from within the same board?
EDIT: Here is my WIP board. The hostname I filled in by hand now, unfortunately there isn't a sensor in HWiNFO telling the name, any idea of a better way to monitor that so it might be possible to monitor multiple systems from within the same board?
Attachments
Last edited:
To answer my own question yes, it is possible to get network stats. IO wait isn't available but disk writes and reads are all there which is enough for me, now to create a complete grafana board!
EDIT: Here is my WIP board. The hostname I filled in by hand now, unfortunately there isn't a sensor in HWiNFO telling the name, any idea of a better way to monitor that so it might be possible to monitor multiple systems from within the same board?
There is "instance" attribute by default Prometheus that is IP address and port or computer name; depending how you have your Prometheus scrapers configured. I should add the attribute "host" in the list, so that could be used.
You can check out how "instance" serves you; the notation is something like {{instance}} in the legend field. If you check the default Grafana .json provided in the PromDapter package, it should show you how its used.
NOTE: Be careful if you (re?)import it, as its named exactly the same as you have now. To not accidentially overwrite your own dashboard.
Indeed I imported the default one from the repo and changed it to fit my needs
. I saw the instance property indeed, is quite useful, but it would be even better if I could have the hostname, it's a bit easier to distinguish nodes by name then by IP. Thank you for the tip!I agree that the hostname is kind of mandatory to be honest. I try to activate on PromDapter in coming week and see if I can get those few quite small but big improvements done
That would be really awesome! Thank you so much for this awesome piece of software
!beerglass007
New Member
Great work love this
Quick question has anyone got any Grafana .JSON dashboards they can share please ?
I've done one panel but interested to see how people have built them and what information they collect
Thanks
Quick question has anyone got any Grafana .JSON dashboards they can share please ?
I've done one panel but interested to see how people have built them and what information they collect
Thanks
Great work love this
Quick question has anyone got any Grafana .JSON dashboards they can share please ?
I've done one panel but interested to see how people have built them and what information they collect
Thanks
I wish I had my newest one, but I need to recreate it. I'm running Grafana on Kubernetes and... my Prometheus has its persistent volume set, but I learned the hard way that my Grafana didn't.
I'll post it back one I manage to recreate it; it's based on the example though, but with some additions (like Corsair HX1000i Power supply info).
I added now the "host" attribute in the latest release. If you could check it out and report back if it's working, I'd appreciateThat would be really awesome! Thank you so much for this awesome piece of software
.Release PromDapter HWiNFO Beta 0.9.18 · kallex/PromDapter
Added host categorization attribute for metrics Attempt to fix duplicate "# HELP " tags
 github.com
Just for the quick heads up. As of the changes with HWiNFO's licensing model, PromDapter will require the Pro version to stay functional.
I personally support the change. PromDapter will remain free add-on, and we also get the benefit of being able to open the whole source stack now, thanks for the change of making shared memory model completely public.
I will work towards opening it asap, including publication of NuGet package(s) for the adapter; if someone wants it immediately (as I'm bit occupied elsewhere), let me know and I can speed the opening up.
Fisherman's Friend
Member
I wish I had visited this forum before I tried to find out the hard way why my dash isn't working anymore.Just for the quick heads up. As of the changes with HWiNFO's licensing model, PromDapter will require the Pro version to stay functional.
I personally support the change. PromDapter will remain free add-on, and we also get the benefit of being able to open the whole source stack now, thanks for the change of making shared memory model completely public.
I will work towards opening it asap, including publication of NuGet package(s) for the adapter; if someone wants it immediately (as I'm bit occupied elsewhere), let me know and I can speed the opening up.
TL;DR To all users, don't upgrade to HWi 7.0 unless you are a) willing to pay for the HWi Pro license and b) @Kallex has been able to submit the required changes to PromDapter (if I understood correctly)
I wish I had visited this forum before I tried to find out the hard way why my dash isn't working anymore.
TL;DR To all users, don't upgrade to HWi 7.0 unless you are a) willing to pay for the HWi Pro license and b) @Kallex has been able to submit the required changes to PromDapter (if I understood correctly)
I am not aware if there are any changes in the actual memory layout. I haven't personally upgraded to 7.0 yet - figuring out the proper licensing model first as I'm getting it for Corporate use myself.
Fast/easy way to test is to see, if the 7.0 is functional as-is when the Shared Memory is enabled (of course until it disables after 12 hours).
Fisherman's Friend
Member
I am not aware if there are any changes in the actual memory layout. I haven't personally upgraded to 7.0 yet - figuring out the proper licensing model first as I'm getting it for Corporate use myself.
Fast/easy way to test is to see, if the 7.0 is functional as-is when the Shared Memory is enabled (of course until it disables after 12 hours).
If it helps, below my debug trace for restarting PromDapter after upgrade to HWi 7.0. This happened immediately after update, no 12 h grace period.
Code:
EDIT redacted the log, seems like I missed the shared memory setting that wasn't enabled after update
Last edited:
Similar threads
- Sticky
- Replies
- 35
- Views
- 12K
- Replies
- 2
- Views
- 3K
- Replies
- 3
- Views
- 3K